
Figure 1.
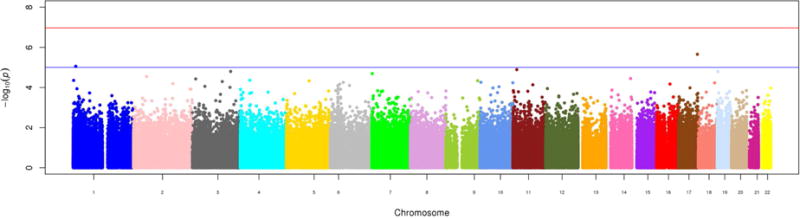
Manhattan plot of epigenome-wide results of testing for association between methylation at > 450,000 cytosine-phosphate-guanine sites and circulating trimethylamine-N-oxide. The X-axis displays the chromosome on which the site is located, the Y-axes display −log10(P-value). The red horizontal line indicates the threshold for epigenome-wide statistical significance after a Bonferroni correction. [Format double column; color figure]