Fig. 3.

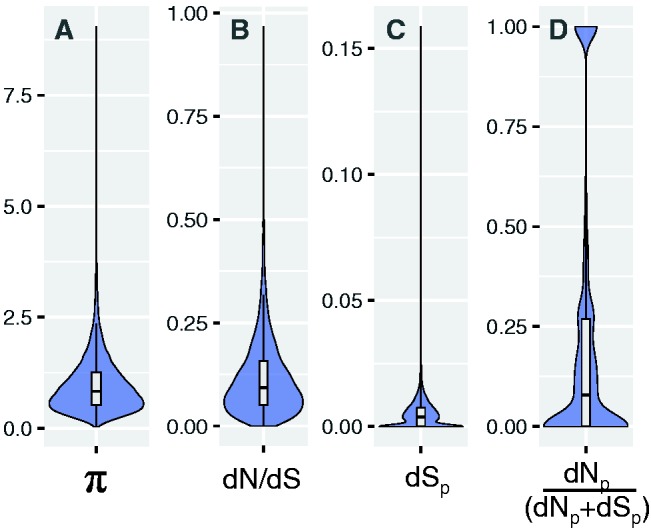
Distribution of expression plasticity (π), species divergence (dN/dS), rates of synonymous substitutions (dSp), and population divergence (dNp/(dNp + dSp)). Violin plots showing the distribution of different quantitative measures of gene expression and sequence evolution for all 10,012 genes expressed in larvae of Cardiocondyla obscurior. (A) Distribution of π as a measure of gene expression plasticity. (B) Distribution of dN/dS ratios for 1-to-1 orthologs between Cardiocondyla obscurior and Monomorium pharaonis. (C) Distribution of the rate of synonymous substitutions (dSp) separating two populations of C. obscurior from Brazil (BR) and Japan (JP). (D) Distribution of the ratio of nonsynonymous substitutions per nonsynonymous site (dNp) and the sum of dNp and nonsynonymous substitutions per nonsynonymous site (dSp) separating the BR and JP populations [dNp/(dNp+dSp)]. Boxplots show the median, inter-quartile ranges (IQR) and 1.5 × IQR.
