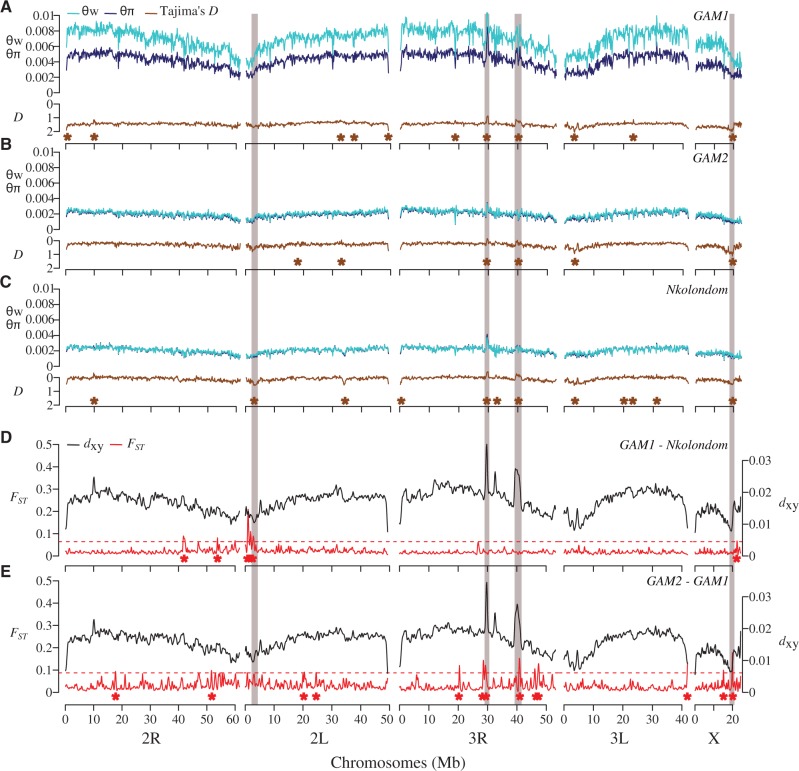
Fig. 5.
Genome scans reveal footprints of global and local adaptation in An. gambiae subpopulations. (A–C) Diversity and Tajima's D are plotted for each of the three subpopulations. Brown asterisks denote windows above the 99th percentile or below the 1st percentile of empirical distribution of Tajima’s D. (D, E) Both absolute (dxy) and relative (FST) divergence between populations are plotted across 150-kb windows. Red asterisks indicate windows above the 99th percentile of empirical distribution of FST. In all populations, concordant dips in diversity and Tajima’s D are evident near the pericentromeric region of 2L where the para sodium channel gene is located. Three other selective sweeps located on the X and 3R chromosomes are highlighted (gray boxes).

