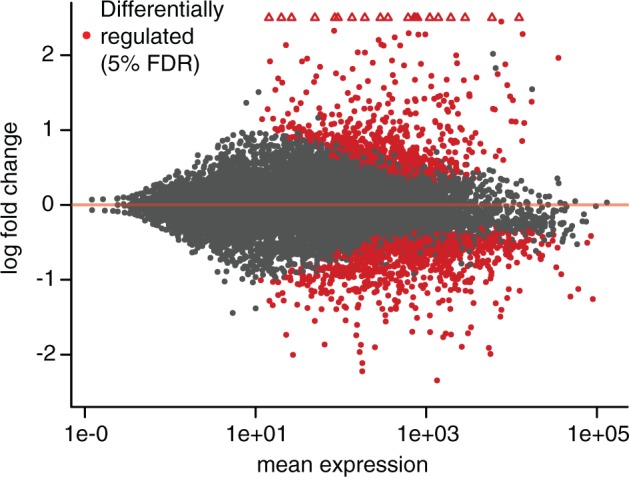
Fig. 1.

MA plot of RNA-seq data comparing uninfected control (sterile wounded) samples to infected samples. The x-axis shows mean expression for each Musca domestica gene (as estimated in DESeq2), and the y-axis shows log2 fold change (infected vs. uninfected), also estimated in DESeq2. Points in red are differentially regulated between treatments at a 5% FDR. Open triangles represent points with log2 fold change >2.5.
