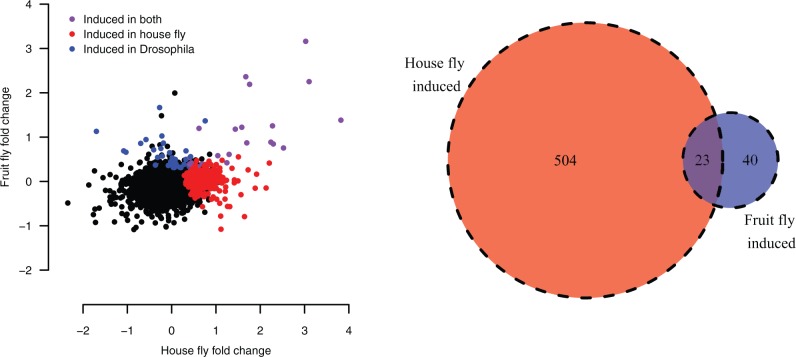
Fig. 3.
The correlation between fold change after infection in house fly and fruit fly. Each point represents a single 1:1 ortholog with expression data in both species. Genes with significant upregulation after infection in either fruit fly, house fly, or both are colored; significant upregulation is defined based on a 5% FDR estimated with DESeq2. The Venn diagram shows the number of 1:1 orthologs in each induction class.

