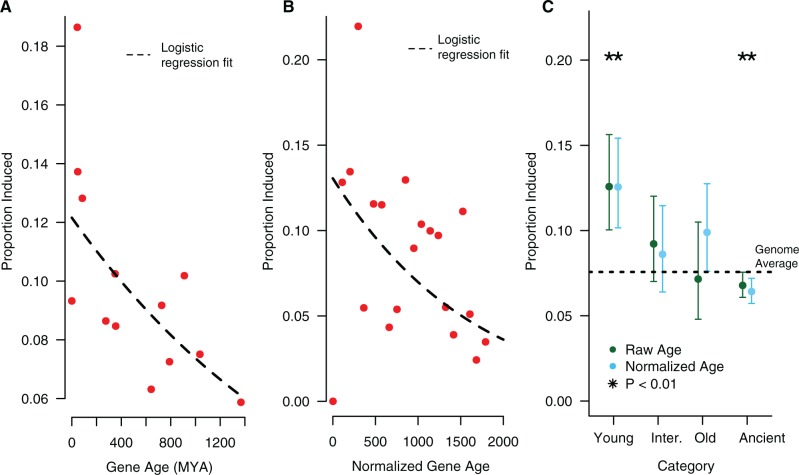
Fig. 4.
(A) The proportion of genes induced by infection for each inferred gene age. The dashed line shows the logistic regression fit, which is highly significant (age β = −5.53 × 10−04, P = 7.88 × 10⁻¹³). (B) The proportion of genes induced by infection for each normalized gene age. The dashed line shows the logistic regression fit, which is highly significant (age β = −6.94 × 10−04, P = 2 × 10⁻¹⁶). Note that the normalization procedure generates a continuous distribution of ages, but for plotting purposes we converted this back to discrete age classes. (C) Proportion of genes induced by infection by age category. After classifying genes into one of four categories based on either raw (uncorrected) age (green points) or normalized (corrected) age (blue points), we estimated the proportion of each age class induced by infection. The dotted line shows the genome-wide average proportion genes induced by infection (0.081). To estimate significance, each category was compared with the remaining categories in turn using a chi-squared test. We get similar results using a logistic regression to estimate the effect of each category relative to the “ancient” group.

