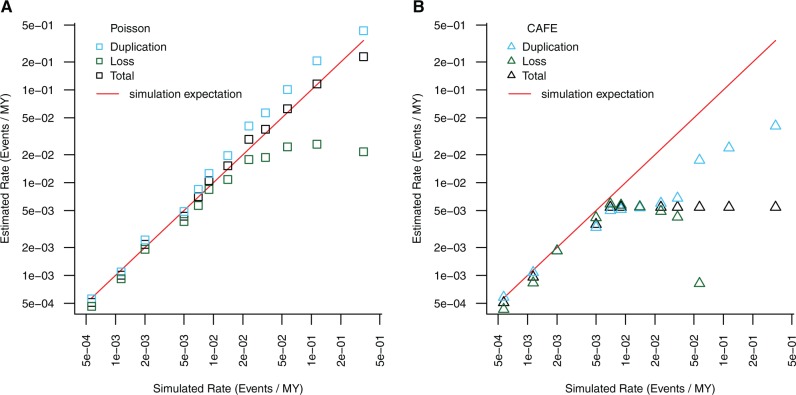
Fig. 6.
Analysis of simulated gene duplication data. The same simulation inputs (supplementary table S5, Supplementary Material online) were analyzed with our Poisson regression framework (A) and with CAFE (B) for a range of simulated duplication/loss rates. Points represent estimated turnover (duplication + loss, black), loss (green) and duplication (blue) rates estimated with each method; the red line is the expectation based on the simulated input values.

