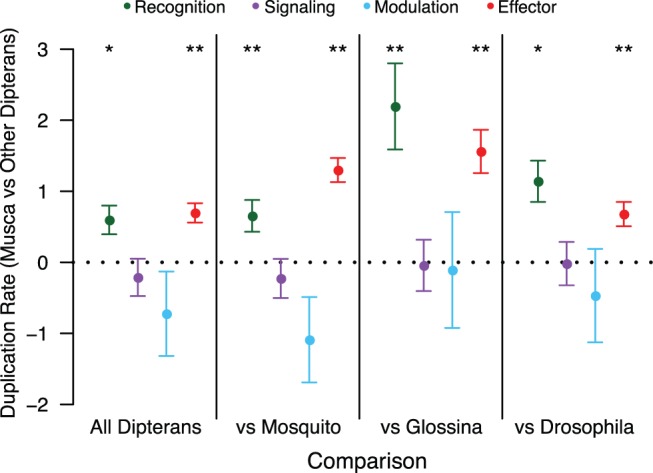
Fig. 7.

Linear contrasts testing the relative duplication rate in the Musca lineage versus other Dipterans for specific immune classes. Each point represents the estimated linear contrast (±SE) for the duplication rate of genes in that category in Musca, compared with the duplication rate of genes in that category in all other Dipterans together or in individual non-Musca lineages. P values are listed above each point for the test of whether the contrast is equal to 0, which is the expectation if the duplication rate for that category is equal on the Musca branch and the rest of the tree (* 0.01 < P < 0.05, ** P < 0.01).
