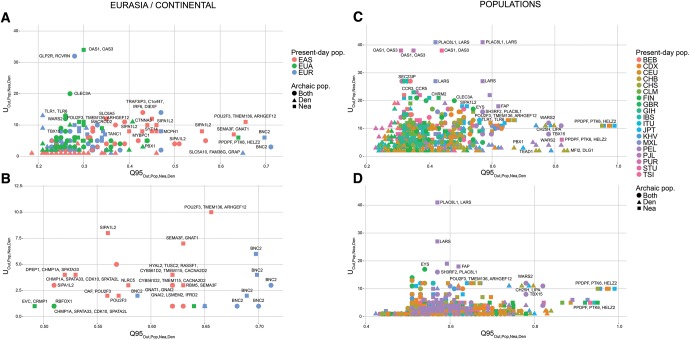
Fig. 8.
We plotted the 40kb regions in the 99.9% highest quantiles of both the and statistics for different choices of target introgressed population (Pop) and outgroup non-introgressed population (Out), and different archaic allele frequency cutoffs within the target population (x). (A) We plotted the extreme regions for continental populations EUR (Out = EAS + AFR), EAS (Out = EUR + AFR), and Eurasians (EUA, Out = AFR), using a target population archaic allele frequency cutoff x of 20%. (B) We plotted the extreme regions from the same statistics as in panel A, but with a more stringent target population archaic allele frequency cutoff x of 50%. (C) We plotted the extreme regions for individual non-African populations within the 1000 Genomes data, using all African populations (excluding African-Americans) as the outgroup, and a cutoff x of 20%. (D) We plotted the extreme regions from the same statistics as in panel C, but with a more stringent target population archaic allele frequency cutoff x of 50%. Nea-only = and . Den-only = and . Both = and .

