
Fig. 2. DNA assembly of the plasmonic metamolecules and their chiroptical response.
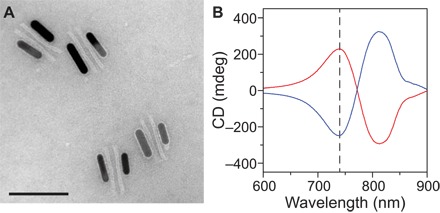
(A) TEM image of the plasmonic nanostructures. The structures tend to lie flat on the TEM grid. Scale bar, 100 nm. (B) Measured CD spectra of the metamolecules in the LH (red line) and the RH (blue line) state from the LH 50% and RH 50% samples at pH 5.5, respectively.