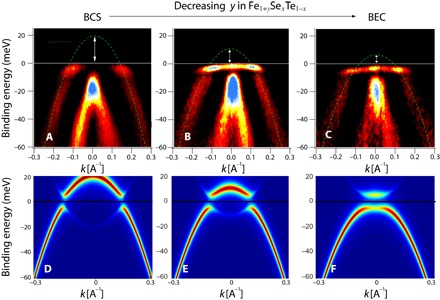
Fig. 1. SC state ARPES spectra.

(A to C) ARPES spectra for three Fe1+ySexTe1−x samples in order of decreasing y (excess Fe) from left to right. The spectra are normalized using the intensity from high-order photons, and a constant background is removed. The spectra are sharpened by adding a small part of their second derivative to the original data. The green dashed line is the best fit to the data using a simple parabolic dispersion. (D to F) Spectral functions, calculated using the model and parameters described in the text, to describe the BCS-BEC crossover seen in the data in the top panels.
