
Fig. 3. ARPES data showing the effect of y on the band structure.
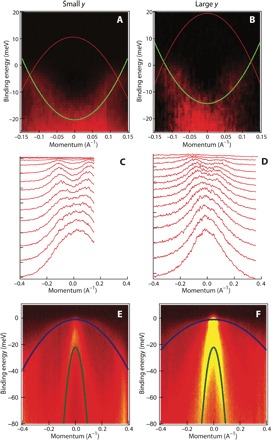
(A and B) ARPES spectra around the M point for two samples with small and large amounts of excess Fe, respectively. A shallow electron pocket can be seen, whose occupied bandwidth decreases with excess Fe. (C and D) The green lines are best fits using a simple parabolic model to the MDCs. The red lines represent the α2 dispersion for the same samples. (E and F) ARPES spectra of the same two samples around the Γ point using vertically polarized 22-eV light. In this polarization, α1 and α3 can be seen. The blue curves represent the dispersion of α3, and the green lines represent that of α1.