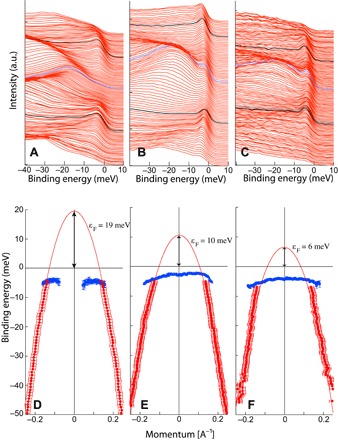
Fig. 4. Coherence peak dispersion in the SC state.

(A to C) EDCs of the same three samples shown in Fig. 1 (A to C), measured at 1 K using horizontally polarized 22-eV photons. The blue line represents the EDC at the Γ point, and the black lines are the EDC at kF. a.u., arbitrary units. (D to F) The blue dots represent the dispersion of the EDC coherence peaks extracted from (A) to (C), respectively. The red dots represent MDC peak positions for binding energies between −5 and −50 meV. The red lines are fits to the latter using a simple parabolic model.
