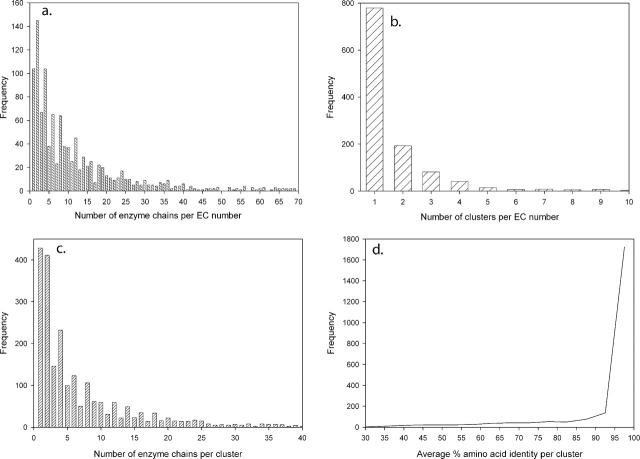
Figure 1.
Statistics for enzyme structures in the PDB. (a) Distribution of the 23 872 enzyme chains in the PDB among the 1176 different EC numbers. The graph is truncated at 70 enzyme chains per EC number; there are isolated instances of higher values up to 933 enzyme chains per EC number. (b) Distribution of the 2280 sequence-similar enzyme clusters among the 1176 EC numbers. The graph is truncated at 10 clusters per EC number; there are isolated instances of higher values up to 44 clusters per EC number. (c) Distribution of the 23 872 enzyme chains in the PDB among the 2280 sequence-similar clusters. The graph is truncated at 40 enzyme chains per cluster; there are isolated instances of higher values up to 475 enzyme chains per cluster. (d) Distribution of clusters with given levels of amino acid sequence identity.

