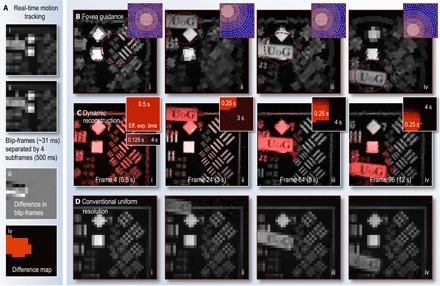
Fig. 4. Fovea guidance by motion tracking.

(A) Low-resolution blip-frames (i to ii), recorded after every fourth subframe. The difference between consecutive blip-frames reveals regions that have changed (iii). A binary difference map (iv) is then constructed from (iii) (see Materials and Methods for details). This analysis is performed in real time, enabling the fovea relocation to a region of the scene that has changed in the following subframes. (B) Frame excerpts from movie S3 showing examples of subframes (each recorded in 0.125 s) guided using blip-frame analysis to detect motion (fovea location updated at 2 Hz). The purple insets show the space-variant cell grid of each subframe. (C) Frame excerpts from movie S4 showing the reconstructed (using linear constraints) video stream of the scene also capture the static parts of the scene at higher resolution. Here, difference map stacks (shown as insets) have been used to estimate how recently different regions of the scene have changed, guiding how many subframes can contribute data to different parts of the reconstruction. This represents an effective exposure time that varies across the field of view. Here, the maximum exposure time has been set to 4 s (that is, all data in the reconstruction are refreshed at most after 4 s), and the effective exposure time has also been color-coded into the red plane of the reconstructed images. (D) Conventional uniform-resolution computational images of a similar scene for comparison (also shown in movie S4). These use the same measurement resource as (B) and (C). Section S7 gives a detailed description of movies S3 and S4.
