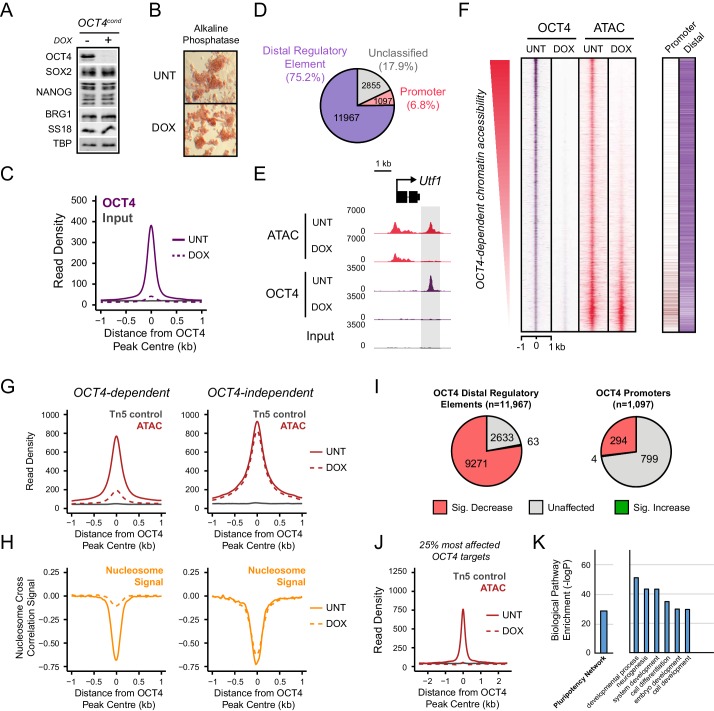
Figure 1. OCT4 binds distal regulatory sites in mouse embryonic stems cells to shape chromatin accessibility.
(A) Western blot analysis of OCT4cond (ZHBTC4) mouse ESCs before (UNT) and after 24 hr treatment with doxycycline (DOX). (B) Alkaline phosphatase staining of OCT4cond mouse ESCs before (UNT) and after 24 hr DOX treatment. (C) A metaplot of OCT4 ChIP-seq signal in OCT4cond ESCs before (UNT) and after 24 hr DOX treatment at OCT4 peaks (n = 15920). (D) Annotation of OCT4 peaks as promoters or distal regulatory elements using the relative enrichment of promoter-associated H3K4me3 or distal regulatory element-associated H3K4me1. (E) A genomic snapshot of ATAC-seq and OCT4 ChIP-seq signal in OCT4cond ESCs before (UNT) and after 24 hr DOX treatment at the Utf1 locus. The downstream OCT4-bound regulatory element is highlighted in the grey box. (F) A heatmap illustrating OCT4 targets (n = 15920) ranked by their loss of chromatin accessibility (ATAC-seq) after 24 hr DOX treatment of OCT4cond ESCs. Normalised read densities for ATAC-seq and OCT4 ChIP-seq are presented, with a heatmap indicating their annotation as either promoters or distal regulatory elements (right). (G) A metaplot of OCT4cond ATAC-seq signal before (UNT) and after 24 hr DOX treatment at OCT4 binding sites with significant reductions in ATAC-seq signal (OCT4-dependent; n = 11557) and those without significant changes (OCT4-independent; n = 4362). Tn5 control represents transposition of purified genomic DNA to control for potential sequence bias. (H) As in (G), profiling the changes in nucleosome occupancy before (UNT) and after (DOX) OCT4 depletion. Nucleosome signal was generated using the NucleoATAC package. (I) Piecharts identifying the proportion of OCT4-bound distal regulatory elements (left) or OCT4-bound promoters (right) that display significant changes in chromatin accessibility as measured by ATAC-seq. Changes were deemed to be significant with FDR < 0.05 and a fold change greater than 1.5-fold. (J) A metaplot depicting the OCT4cond ATAC-seq signal before (UNT) and after (DOX) treatment at the 25% of OCT4 peaks with the greatest changes in ATAC-seq signal following OCT4 depletion. (K) Gene ontology analysis for genes closest to OCT4 target sites depicted in (J). This reveals an enrichment for the pluripotency expression network (left) and biological processes associated with developmental gene regulation (right).


