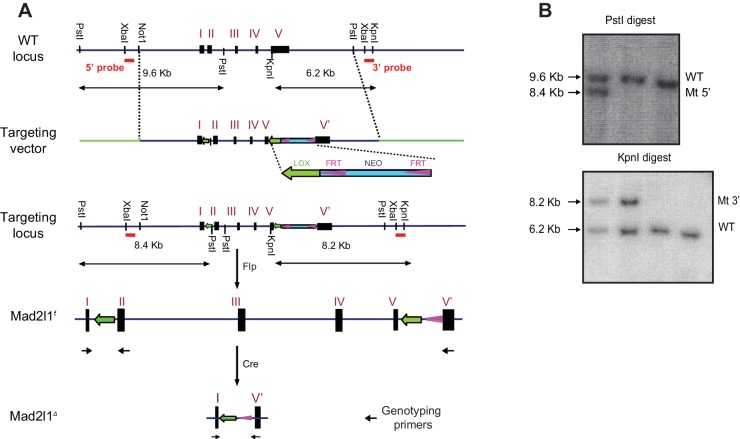
Figure 1. Tissue specific loss of Mad2l1 leads to T-cell acute lymphoblastic lymphoma in T cells in a permissive Trp53null background.
(A) Schematic overview of the Mad2l1 conditional allele before and after Cre-mediated recombination. The red triangles refer to the loxP sites that surround exon 2 to exon 5; roman numerals refer to exons. (B, C) PCR for Mad2l1 genotypes and recombination of the Mad2l1f allele in (B) thymocytes and (C) liver tissue (L) or tail tissue (T). (D) Kaplan Meier plots showing survival of the indicated genotypes for Lck-Cre::Mad2l1f/f::Trp53f/f compared to control mice. Statistical tests for compared Mad2l1f/f and Mad2l1+/+ having same Trp53 genotype, **p<0.01 (Mantel-Cox test). Control curves (Lck-Cre::Trp53f/fand Lck-Cre) were same animals as used in Foijer et al. (2014). (E) Images showing enlarged thymus and spleen in a Lck-Cre::Mad2l1f/f::Trp53f/f mouse compared to a healthy control. (F) Average thymus and spleen weights for tumor-bearing Lck-Cre::Mad2l1f/f::Trp53f/f mice compared to unaffected control mice. (G) Representative H&E staining of control thymus (upper panel) and Lck-Cre::Mad2l1f/f::Trp53f/f acute T acute lymphoblastic lymphoma sample with staining indicating an undifferentiated cell state (lower panel). Scale bar 10 microns. (H) Forward and side scatter (FSC, SCC) plots for normal (appearing) thymuses and a T-ALL showing the emergence of a larger blasting population, before thymus size increased (upper panels). FSC and SCC plots for thymus, blood and spleen of a tumor-bearing mouse, showing blasting cells in thymus and spleen, but not blood (lower panels).


