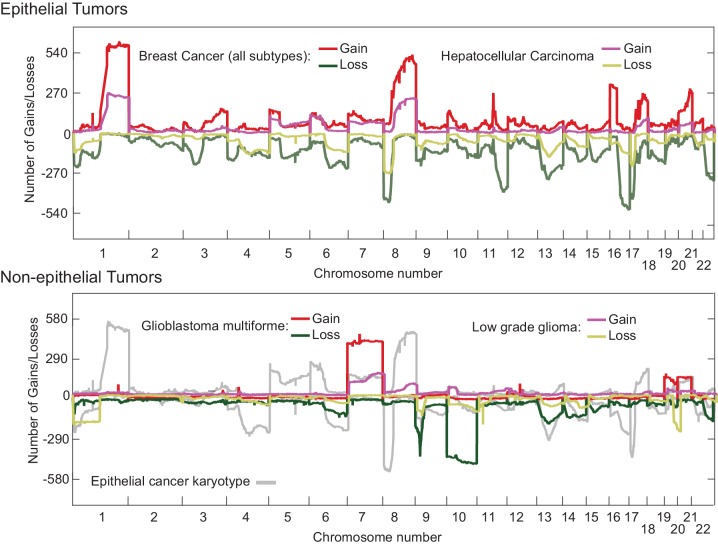
Figure 7. Overlaid TCGA copy number data at kilobase resolution for epithelial (Hepatocellular carcinoma and Breast Cancer, upper panel) and non-epithelial (Glioma and Glioblastoma multiforme, lower panel) represented as the number of tumors above a log2 threshold of 0.3 for gains and below −0.3 for losses.
The Y-axis is scaled to the total number of tumors analyzed. Analyzed data was sequenced at the Broad institute (Boston, MA) on SNP6.0 chips.

