. 2017 Apr 10;6:e24570. doi: 10.7554/eLife.24570

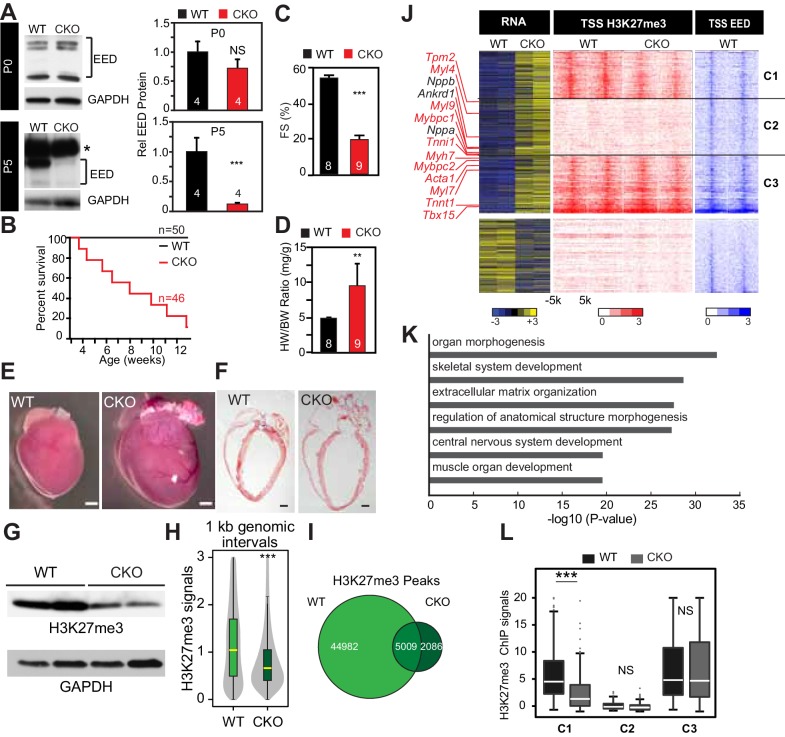
Figure 1. Neonatal cardiomyocyte inactivation of Eed caused lethal dilated cardiomyopathy.

(A) EED protein expression in WT and cardiac EedCKO (CKO, Myh6-Cre+;Eedf/f) on postnatal days 0 (P0) and 5 (P5). Quantification shows relative EED protein normalized to GAPDH loading control. Several splice isoforms of EED were detected. * indicates a non-specific band that is larger than full length EED's predicted molecular weight. (B) Kaplan-Meier survival curve of WT and EedCKO mice. (C) Heart function was measured by echocardiography as fractional shortening (FS%) at 2 months of age. See Figure 1—figure supplement 2A for FS% at earlier time points. (D–F) Cardiac dilatation and hypertrophy were observed by heart to body weight ratio (D), gross morphology (E), and histology (F) in WT and EedCKO at 2 months of age. Representative hearts are shown. Bar = 1 mm. (G) Immunoblotting for H3K27me3 in cardiomyocytes from WT and EedCKO at 2 months of age. (H) Genome-wide distribution of H3K27me3 ChIP-seq signals in WT and EedCKO purified cardiomyocytes. ChIP-seq signal was measured in 1 kb windows across the genome. The signal distribution is displayed as a violin plot. Yellow lines denote the median value. (I) Venn diagram showing the distribution of H3K27me3 peaks in WT and EedCKO heart. (J) Heat map of RNA transcript levels of differentially expressed genes (fold-change >1.5 or <0.67 and adjusted p-value<0.05) are shown in the left heatmap. Expression values for each gene were row scaled. Selected contractile myofiber and heart failure marker genes are shown in red and black, respectively. Right heatmap shows H3K27me3 and EED ChIP-seq signal at the transcriptional start site (TSS) of the differentially expressed gene on the same row. Gene expression, H3K27me3, and EED ChIP-seq studies were performed on purified cardiomyocytes at 2 months of age. Rows were ordered by k-means clustering on H3K27me3 and EED ChIP-seq signal into three clusters, C1-C3. (K) Gene Ontology analysis of differentially expressed genes between WT and EedCKO. The top six significant terms are shown. (L) Box plots showing H3K27me3 signals in these three clusters as shown in J. A, C, D, Student’s t-test; H, L, Wilcoxon-Mann-Whitney test. *p<0.05; **p<0.01; ***p<0.001, NS, not significant. Numbers in bars indicate independent biological replicates.

DOI: http://dx.doi.org/10.7554/eLife.24570.002

Figure 1.

Figure 1—figure supplement 1. Eed depletion in WT and EedCKO mice.
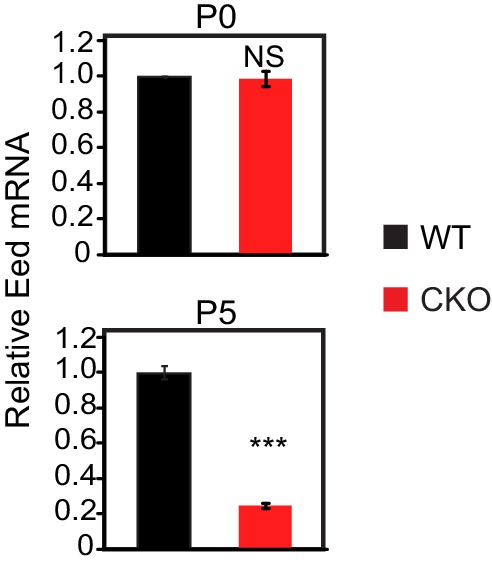
Figure 1—figure supplement 1.

Heart apexes were harvested for qRT-qPCR for relative Eed mRNA expression on postnatal days 0 (P0) and 5 (P5). Heart apex contains both cardiomyocytes and non-cardiomyocytes. The non-myocytes likely account for the detected level of Eed mRNA in EED-CKO. p-Value by Student’s t-test. ***p<0.001. NS, not significant.
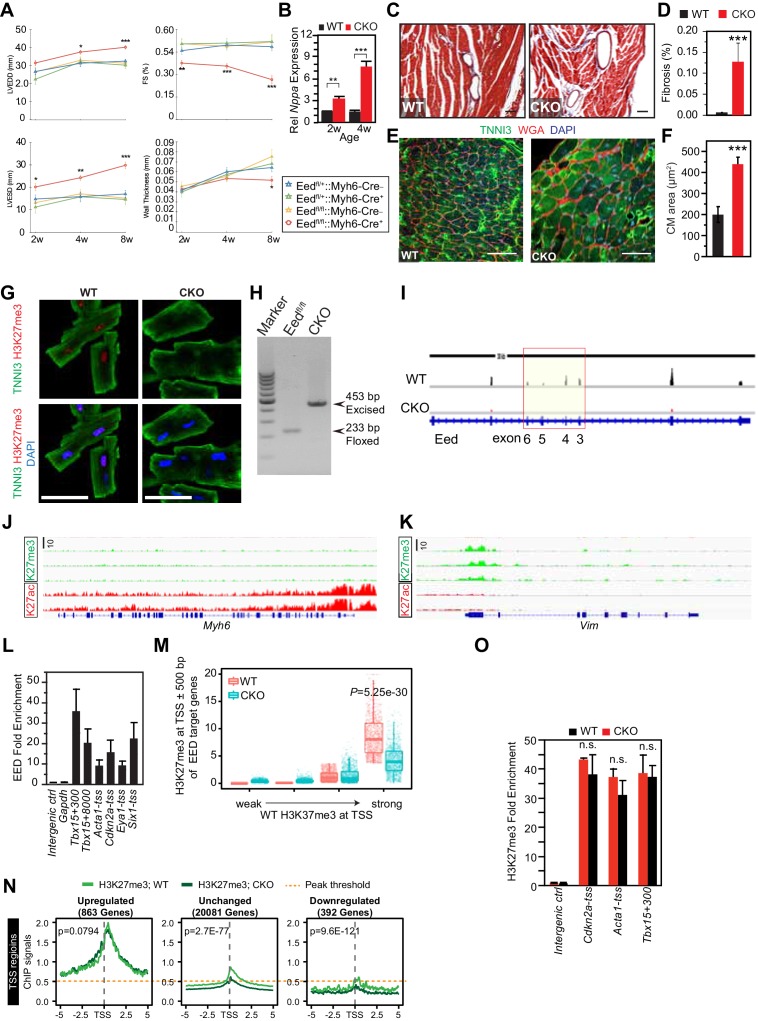
Figure 1—figure supplement 2. Characterization of EedCKO mice.

Figure 1—figure supplement 2.

(A) Progressive cardiac dysfunction and dilatation after cardiomyocyte-restricted ablation of Eed. w, weeks. (B) Nppa mRNA level in WT and CKO hearts at the indicated ages. w, weeks. (C, D) Cardiac fibrosis was evident by Mason Trichrome staining at 2 months of age. Fraction of myocardial area occupied by fibrotic tissue (blue staining) was quantified using ImageJ. Bar = 50 µm. (E, F) Immunofluorescence for cardiomyocyte marker TNNI3 and cardiomyocyte membrane marker WGA, and quantification of cell size from WGA-stained cardiomyocyte outlines (f). Bar = 50 µm. (G) Immunostaining for TNNI3 and H3K27me3. Isolated adult cardiomyocytes were >95% pure and EedCKO CMs had little H3K27me3 signal. Bar = 50 µm. (H) PCR of genomic DNA from purified CMs using primers that amplify unexcised floxed DNA (233 bp product) or Cre-excised DNA (453 bp product). In CKO-purified CMs, unexcised floxed DNA was not detected, consistent with highly efficient Cre-mediated gene inactivation, as well as high purity of dissociated CMs. (I) RNA-seq track view showing deletion of floxed exons 3–6 of Eed (red box). (J,K) Genome browser view ofH3K27me3 and H3K27ac ChIP-seq signals on Myh6 (J) and Vim (K) loci in purified adult cardiomyocytes. (L) EED enrichment on downstream genes was measured by ChIP-qPCR in P5 heart ventricle apex. Numbers following gene names indicate the number of nucleotides between the probed amplicon and the TSS. (M) Box and scatter plots of H3K27me3 at TSS ±500 bp of EED target genes in four quantiles of WT H3K27me3 intensity. (N) Aggregation plots of H3K27me3 ChIP-seq signals near the TSS of genes upregulated, downregulated, or unchanged between WT and EEDCKO. O. H3K27me3 enrichment was measured by ChIP-qPCR on target genes using adult cardiomyocytes isolated from WT and EEDCKO hearts. *p<0.05; **p<0.01; ***p<0.001 by ANOVA with Dunnett’s post-hoc test using Eedfl/+::Myh6-Cre– as the control group (A), by Welch’s t-test (B,D,F,N,O), or by Wilcoxon-Mann-Whitney test (M).