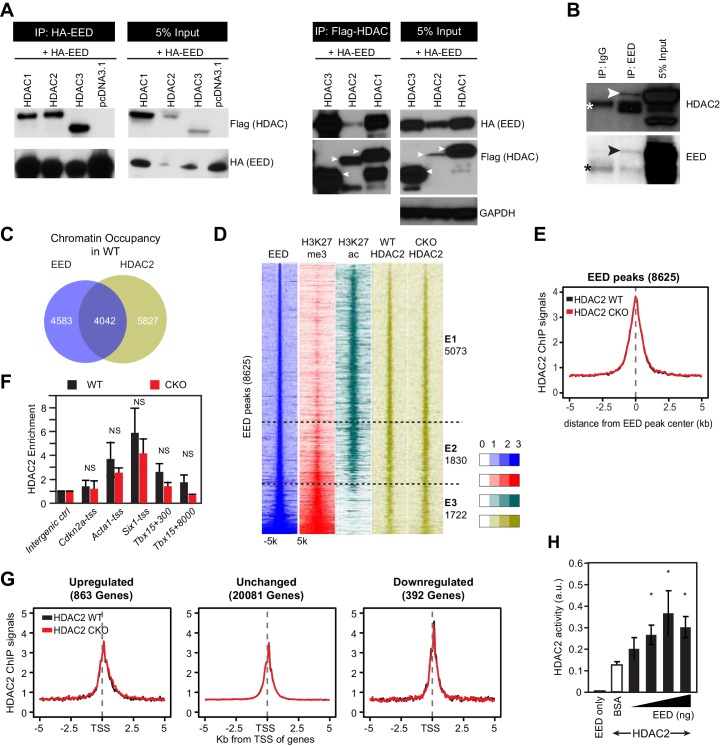
Figure 4. EED interacts with and co-localizes with HDAC to repress transcription through enhancing its deacetylation activity.
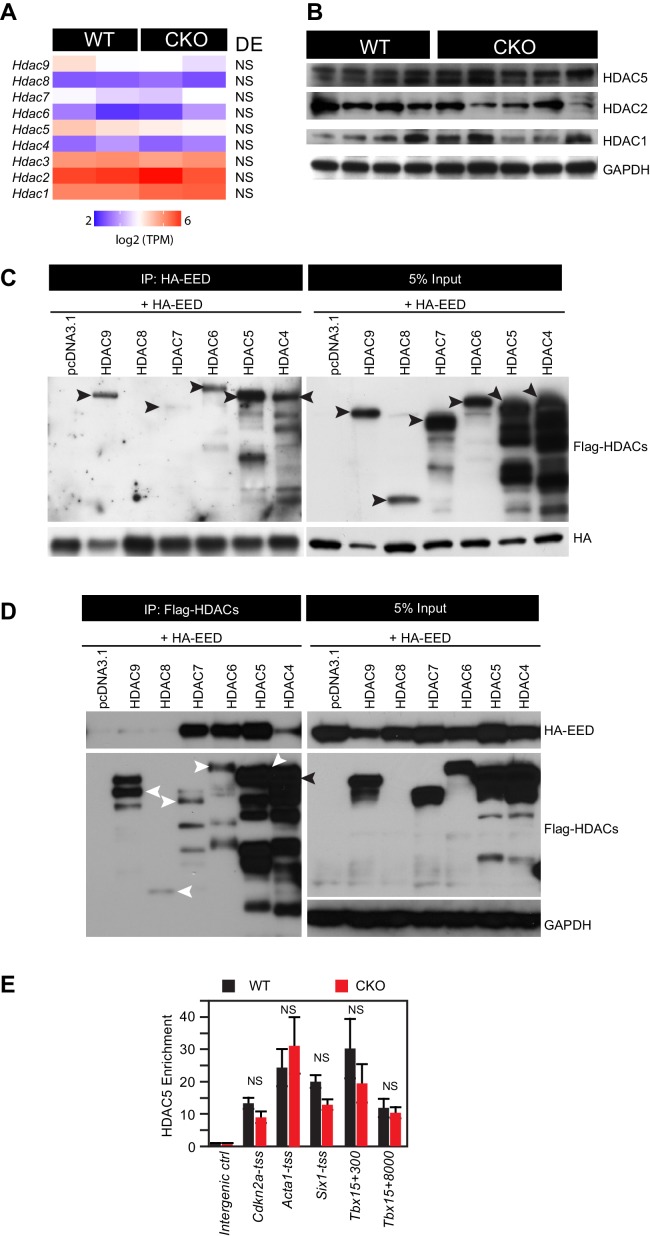
(A) Co-Immnoprecipitation analysis of EED-HDAC interaction in 293 T cells. HA-EED pull down with HA antibody co-precipitated FLAG-HDAC1/2/3 (left). Reciprocally, FLAG-HDAC1/2/3 pull down with Flag antibody co-precipitated HA-EED (right). Data on HA-EED and Flag-HDAC4-9 interaction are presented in Figure 4—figure supplement 1C,D. (B) Interaction between endogenous EED and HDAC2. EED, immunoprecipitated from HL-1 cardiomyocyte-like cells, co-precipitated HDAC2. Arrowhead denotes the specific band and asterisk denotes the non-specific IgG heavy chain band. (C) Venn diagram showing overlap of EED and HDAC2 peaks in WT. (D) Heatmaps showing ChIP-seq signals for EED, H3K27me3, H3K27ac and HDAC2 at ±5 kb of EED peak centers. Rows were sorted by ascending EED peak signal. (E) Aggregate plot showing HDAC2 ChIP signals in WT and EedCKO, centered on EED peak centers. (F) HDAC2 occupancy of the indicated chromatin regions in isolated cardiomyocytes from WT and EedCKO mice at 2 months of age. Occupancy was measured by ChIP followed by quantative PCR (ChIP-qPCR). Chromatin regions are named by the adjacent gene and the distance to the TSS. (G) Aggregation plot showing HDAC2 ChIP-seq signals in WT and EedCKO at ±5 kb of TSS of genes that were upregulated, unchanged or downregulated in EedCKO. (H) Effect of EED on HDAC2 activity. In vitro deacetylation assay was performed using recombinant active HDAC2 (50 ng) in the presence of BSA or 5 to 100 ng of recombinant EED, purified from insect cells. Deacetylation activity was measured by colorimetric assay. F, H, I, J, K, Unpaired Student’s t-test. *p<0.05; **p<0.01; ***p<0.001.
Figure 4—figure supplement 1. HDAC-EED interaction.
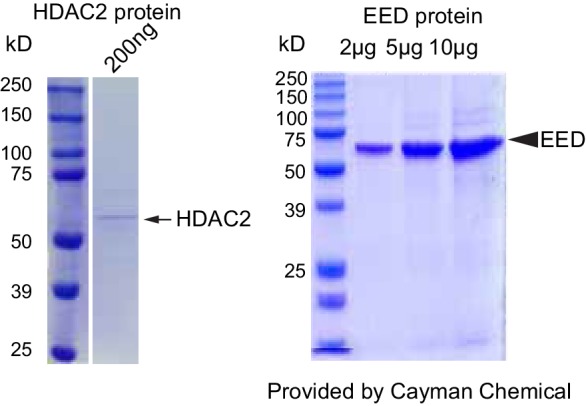
Figure 4—figure supplement 2. Validation of HDAC2 and EED proteins purity and dCas9-EED interaction with EZH2.


