. 2017 Apr 10;6:e24570. doi: 10.7554/eLife.24570

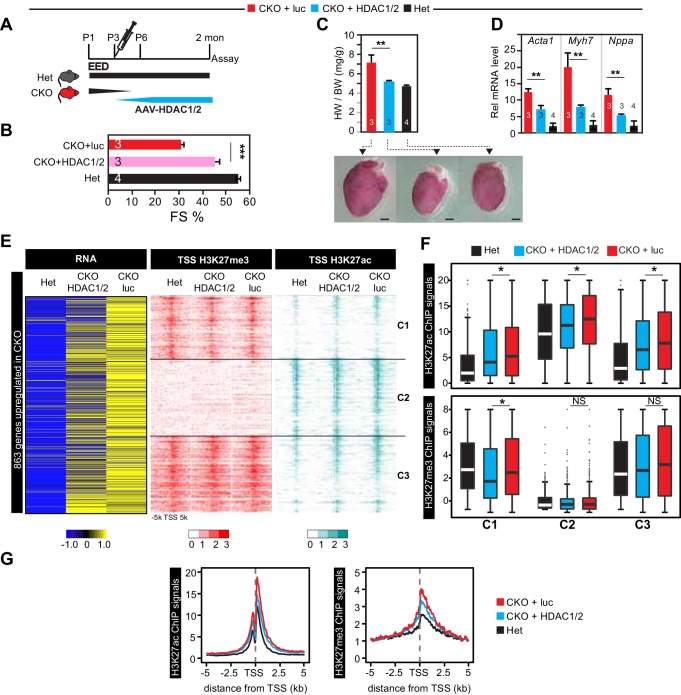
Figure 5. Re-introduction of HDAC1/2 restored normal heart function.

(A) AAV-HDAC1/2 rescue of EedCKO. Schematic shows the rescue experiment design. WT and CKO pups were injected with AAV-luc or AAV-HDAC1/2 at P3, and assays were done at 2 months of age. (B) Heart function (FS%) was measured at 2 months of age by echocardiography. (C) Gross morphology and heart to body weight ratio of hearts from mice at 2 months of age. Bar = 1 mm. (D) Analysis of heart failure gene expression. Acta1, Myh7, and Nppa levels in isolated cardiomyocytes were measured by qRTPCR. (E, F) Heatmaps (E) and box plots (F) showing ChIP signals for H3K27ac and H3K27me3 at ±5 kb of TSS of genes upregulated in EedCKO. Row order and cluster labels are the same as Figure 1J. Comparative analysis of ChIP-seq signals was performed within each cluster as indicated. (G) Aggregation plots for H3K27me3 or H3K27ac ChIP-seq signals at ±5 kb of TSS of EedCKO upregulated genes in Het, CKO+luc, and CKO+HDAC1/2 groups. B,C,D, Unpaired Student’s t-test. F, Wilcoxon-Mann-Whitney test. *p<0.05; **p<0.01; ***p<0.001.

DOI: http://dx.doi.org/10.7554/eLife.24570.012

Figure 5.

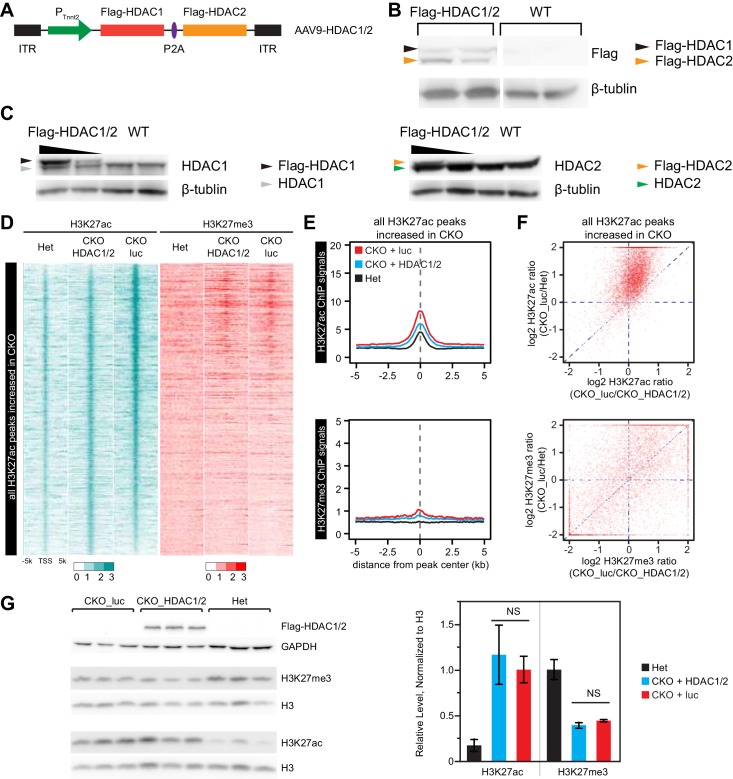
Figure 5—figure supplement 1. Effect of over-expression of HDAC1/2 on genome-wide H3K27ac and H3K27me3 accumulation at H3K27ac peaks with increased signal in EedCKO.

Figure 5—figure supplement 1.

(A) Schematic of AAV9 construct expressing Flag-tagged HDAC1/2 (Flag-HDAC1/2). ITR, Inverted Terminal Repeart. (B) Validation of Flag-tagged HDAC1 and HDAC2 protein expression in AAV-treated hearts. Mice were treated with AAV9-Flag-HDAC1/Flag-HDAC2 or AAV9-Flag-EED at P3. Hearts were analyzed at 2 months of age. (C) Validation of ectopic and endogenous expression of HDAC1 and HDAC2 proteins in AAV-treated hearts of mice at 2 months of age. (D-F) Analysis of H3K27ac and H3K27me3 ChIP signals around all H3K27ac peaks gained in CKO, in het CKO_luc, and CKO_HDAC1/2. Heatmap (D) was sorted by descending value of the ratio of H3K27ac signal in CKO_luc to het. (E) aggregate plots of H3K27ac and H3K27me3 ChIP signals. (F) scatterplot of signal ratios comparing change in EED loss of function to change in HDAC1/2 rescue. Signals are from the peak center ±0.5 kb. (G) Immunoblotting and quantification of H3K27ac and H3K27me3 levels in adult cardiomyocytes isolated from hearts of three groups. H3K27ac or H3K27me3 immunoblot signals were normalized to total H3. NS, not significantly different.