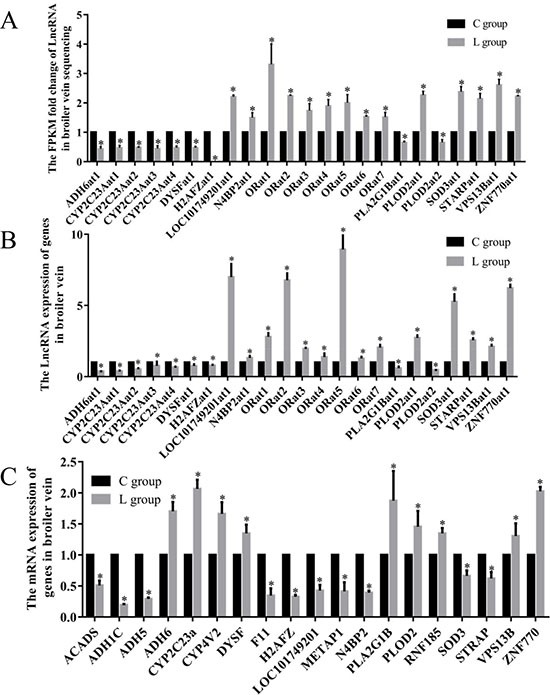
Figure 3. Effects of dietary Se level on the LncRNA and mRNA levels.

(A) The FPKM folds change of LncRNA in broiler chick vein sequencing; (B) Effects of dietary Se level on the LncRNA levels of vein in broiler chick. (C) Effects of dietary Se level on the relative mRNA levels of vein in broiler chick. Each value represented the mean ± S.D. of three individuals. *P < 0.05 versus control group.
