
Figure 1. Metformin treated cancer cells polarized macrophage toward M1 phenotype.
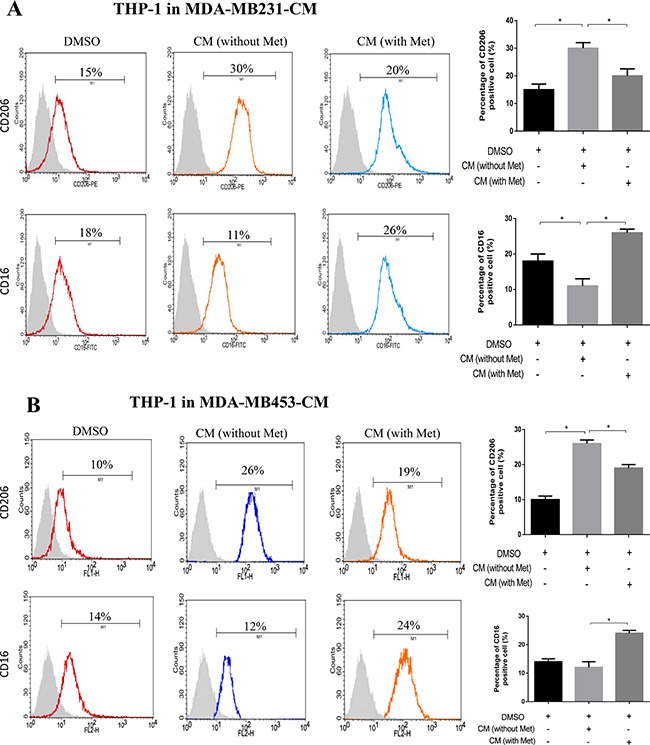
THP-1 cells were stimulated with PMA (200 nM) for 24 h, then incubated with breast cancer (MDA-MB231/MDA-MB453) conditioned medium (CM) with or without metformin (60 μM) for 6 h, followed by flow cytometry analysis to quantify the amount of CD206, an M2 macrophage marker, and CD16, an M1 marker (A, B). Data are expressed as mean ± SD, *p < 0.05. DMSO: control; Met: metformin. Representative flow data shown are from experiments independently performed at least three times.