
Figure 3.
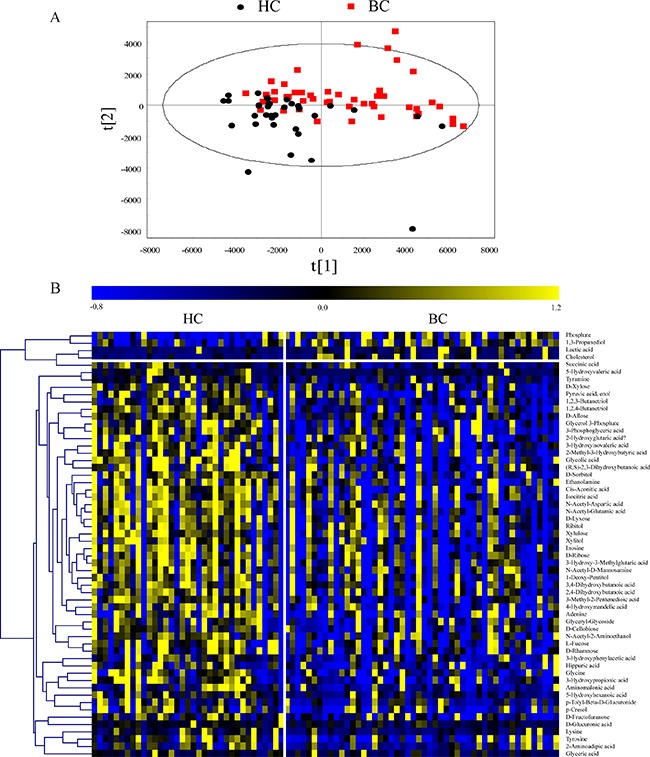
(A) Score scatter plots of the PLS-DA model with Pareto scaling. (B) Heat map of verified differential metabolites.
Official websites use .gov
A
.gov website belongs to an official
government organization in the United States.
Secure .gov websites use HTTPS
A lock (
) or https:// means you've safely
connected to the .gov website. Share sensitive
information only on official, secure websites.
(A) Score scatter plots of the PLS-DA model with Pareto scaling. (B) Heat map of verified differential metabolites.