
Figure 4. Differential metabolite pathway analysis.
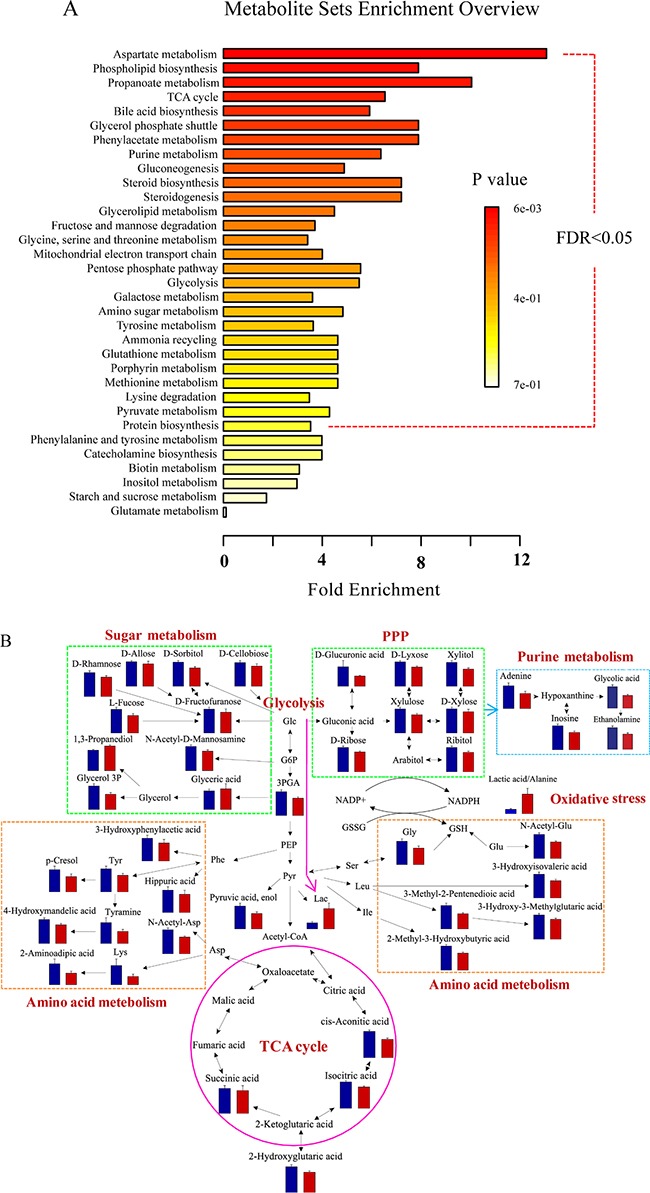
(A) The globally altered pathways in BC. The color depth and column length indicate the disturbance degree of the pathway. (B) Pathway map of the significantly differential metabolites (p < 0.05) between BCs and HCs. The blue and red histograms denote the relative contents of the differential metabolites in the HCs and BCs, respectively. Abbreviations: glucose (Glc), glucose 6-phosphate (G6P), 3-phosphoglyceric acid (3PGA), phosphoenolpyruvic acid (PEP), pyruvic acid (Pyr), lactic acid (Lac), glycerol 3-phosphate (glycerol 3P), phenylalanine (Phe), aspartic acid (Asp), N-acetyl-aspartic acid (N-Acetyl-Asp), lysine (Lys), tyrosine (Tyr), serine (Ser), leucine (Leu), isoleucine (Ile), glycine (Gly), glutamic acid (Glu), N-acetyl-glutamic acid (N-Acetyl-Glu), glutathione (GSH), and oxidized glutathione (GSSH).