
Figure 1. Potential PSA density (PSAD) screening of men with tumor volume.
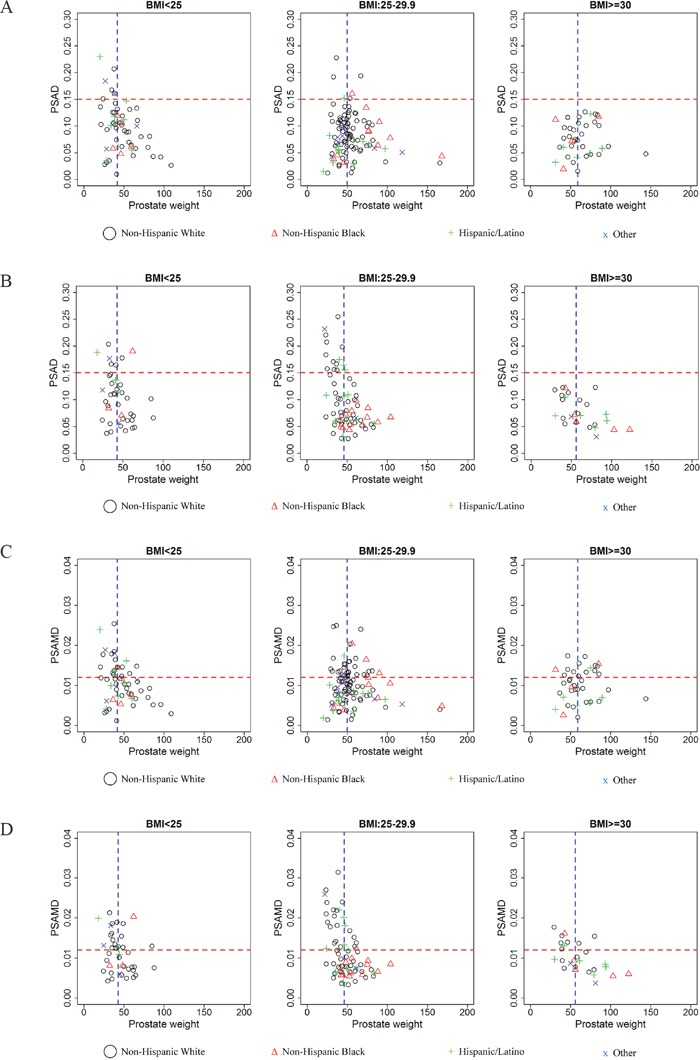
A. <0.5 cm3 and B. ≥0.5 cm3 as well as potential PSA mass density (PSAMD) screening of men with tumor volume: C. <0.5 cm3 and D. ≥0.5 cm3. Both groups are sorted by body mass index (BMI) categories: normal weight (BMI <25), overweight (BMI= 25-29.9, and obese (BMI >30). Cutoff values (horizontal red line) are displayed to indicate those identified by screening test (PSAD >0.15 and PSAMD >0.012) and median prostate weight (vertical blue line) for each group is displayed to compare relatively smaller and larger prostate glands. Race and/or ethnicity is indicated for Non-Hispanic White (black circle), Non-Hispanic Black (red triangle), Hispanic/Latino (green cross), and other men (blue x). Those above the cutoff values with <0.5 cm3 (A) and (C) are considered false positive results, while those above the cutoffs with ≥0.5 cm3 (B) and (D) are considered true positives.