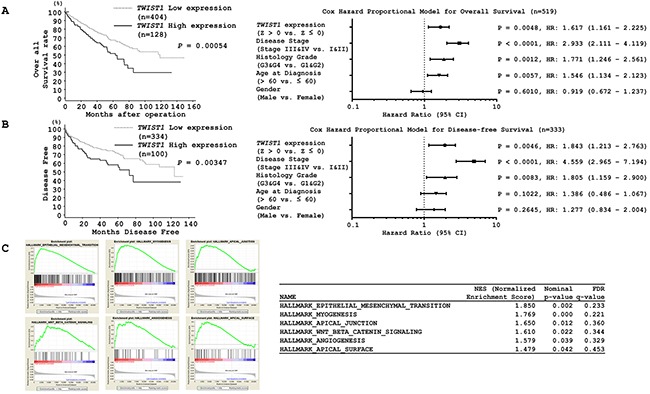
Figure 7. Kaplan-Meier survival plots for high and low TWIST1 expression groups in a TCGA cohort.

A. Overall survival and B. Disease-free survival periods (left) were significantly reduced in the patients with high TWIST1 expression in comparison with the patients with low expression (P =0.00054 and P = 0.00347 respectively). (A) Cox proportional analysis for the prediction of overall survival or (B, left) disease-free survival. C. GSEA indicating six significantly enriched pathways, of which EMT was the most significant.
