
Figure 3. TnTs emanating from SCC cells preferentially connect with other cancer cells rather than to cancer-associated fibroblasts.
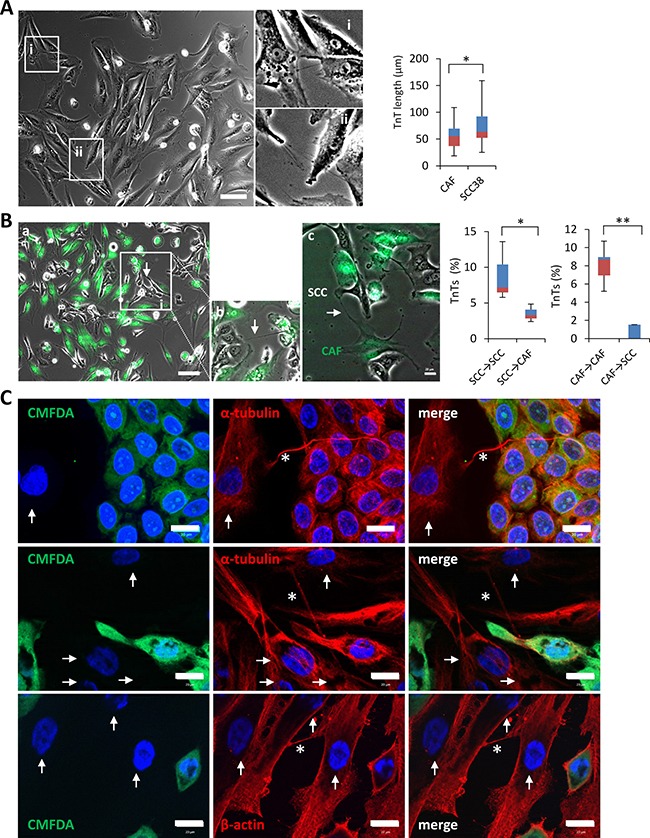
(A) Phase contrast image of cancer associated fibroblasts. Insets at the right (i and ii) show magnified images to better visualize the presence of TnTs connecting fibroblasts. Cells were pictured by using a bright field microscope and an 8×8 tile was used for TnTs identification and counting. Graph shows quantification of TnT length in fibroblasts as compared to those of SCC38 cells. Data are presented as mean ± standard deviation from 2 individual experiments and 380 cells analyzed in each. * indicates P < 0.05. (B) Representative phase contrast plus green fluorescence image of CAFs, labeled with green CMFDA, and SCC cells co-culture. Inset (b) shows a magnified image to better visualize the TnTs connecting a SCC cell with a fibroblast. Image c shows a green TnT that emanates from a CAF and establishes contact with a SCC cell. Cells were pictured by using a bright field plus fluorescence microscope and an 8×8 tile was used for TnTs identification and counting. Graphs show quantification of the percentage of TnTs connecting SCC38-to-SCC38 cells (SCC38→SCC38), SCC38-to-CAFs (SCC38→CAF), CAF-to-CAF (CAF→CAF) or CAF-to-SCC38 cells (CAF→SCC38). Data are presented as mean ± standard deviation from 2 individual experiments and 570 cells analyzed in each. White arrows point to TnTs. * indicates P < 0.05, ** indicate P < 0.005. (C) Representative images of staining for β-actin and α-tubulin in co-cultures of CAFs and SCC38 cells. Adherent SCC38 cells were fluorescently labeled with CellTracker green CMFDA before the addition of un-labeled CAFs. Co-cultured cells were incubated at 37°C for 10–12 hours to allow for CAFs adhesion and TnT formation before immunofluorescence staining. Arrows and asterisks point to CAFs and TnTs, respectively.