
Figure 5. Afatinib affects cancer stem cells in HNSCC cells.
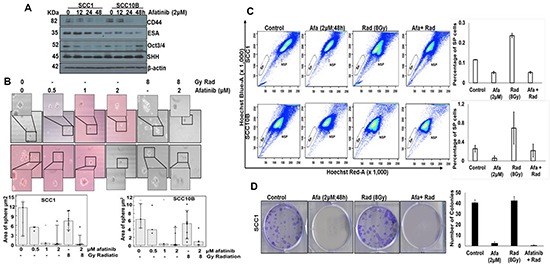
(A) SCC1 and SCC10B cells were treated with 2 μM of afatinib for 12–48 h and analyzed for expression of cancer stem cell markers including CD44, ESA, SHH and Oct3/4 by Western blot analysis. (B) SCC1 and SCC10B cells were treated with 0.5–2μM of afatinib alone for 48 h and SP and NSP cells were isolated by FACS analysis using Hoechst 33342 (5 mg/ml) staining. 1 × 10³ SP and NSP cells were plated in 24-well low attachment plates and analyzed for sphere formation on 14th day and photographed using light microscope. (C) SCC1 and SCC10B cells were treated with either afatinib (48 h) alone or combined with IR. After 48 h, cells were trypsinized and analyzed for SP and NSP cells by FACS analysis using Hoechst 33342 (5 mg/ml) staining. (D) Isolated SP cells (250) were plated on 6 well plate and analyzed for colony formation assay after 2 weeks. The graphs represent the mean (± SE) number of colonies. The experiment was repeated twice (*p < 0.05).