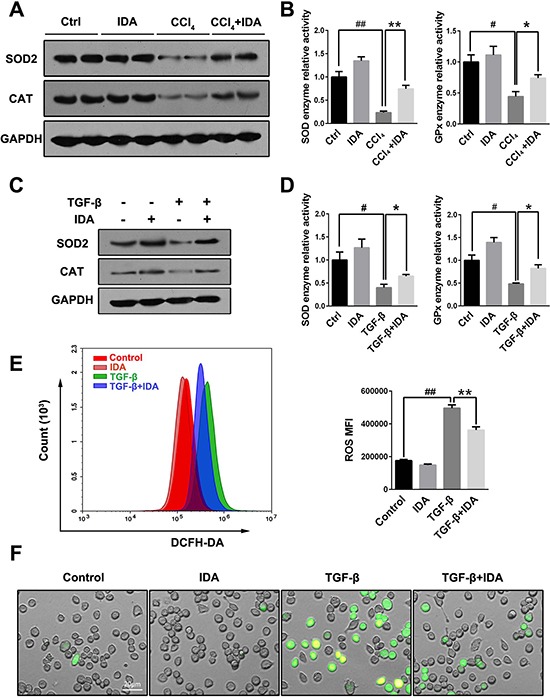
Figure 3. IDA balances oxidative stress and increases the expressions and activities of antioxidant and detoxifying enzymes.

(A) The expressions of superoxide dismutase 2 (SOD2) and catalase (CAT) in liver were measured by western blotting (Two randomly selected samples were presented). (B) The relative enzyme activities of SOD and Glutathione Peroxidase (GPx) in liver were measured by enzyme activity detection kits. (C) LX2 cells were pretreated with IDA (100 uM) for 1 h and then treated with TGF-β (5 ng/ml) for 12 h. The expression of SOD2 and CAT were detected by western blotting. (D) The relative enzyme activities of SOD and GPx in LX2 cells were measured. (E) Intracellular ROS assay. LX2 cells were pretreated with IDA (100 uM) for 1 h and then treated with or without TGF-β (5 ng/ml) for 18 h. Intracellular ROS were measured by flow cytometry (DCFH-DA). The mean fluorescent intensity of intracellular ROS (ROS MFI) were shown. (F) The images of ROS were shown with a fluorescent microscope. The experiments were repeated for three times and data are represented as mean ± SEM. Statistical analyses for two groups comparisons were performed using Student's t test. Statistical analysis for multiple group comparisons was performed using one-way analysis of variance (ANOVA) followed by Duncan's test. #p < 0.05 versus Control; ##p < 0.01 versus Control; *p < 0.05 versus CCl4 or TGF-β; **p < 0.01 versus CCl4 or TGF-β.
