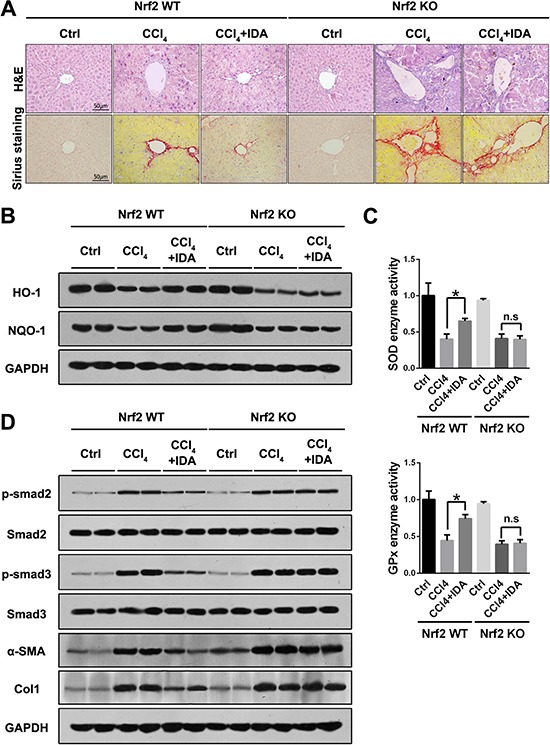
Figure 5. IDA inhibits oxidative stress, Smad signaling and liver fibrosis in a Nrf2 dependent pathway.

(A) Representative images of H&E and Sirius red staining of liver sections from Nrf2 WT or Nrf2 KO mice were shown. (B) The expressions of HO-1 and NQO-1 in liver were detected by western blotting (Two random selected samples in each group). (C) The relative enzyme activities of SOD and GPx in liver tissues were measured. (D) The expressions of p-Smad2, Smad2, p-Smad3, Smad3, α-SMA and Col1 in liver tissues were measured by western blotting. (Two random selected samples in each group). *p < 0.05 vs CCl4; n.s. = No significant. Statistical analyses were performed using Student's t test.
