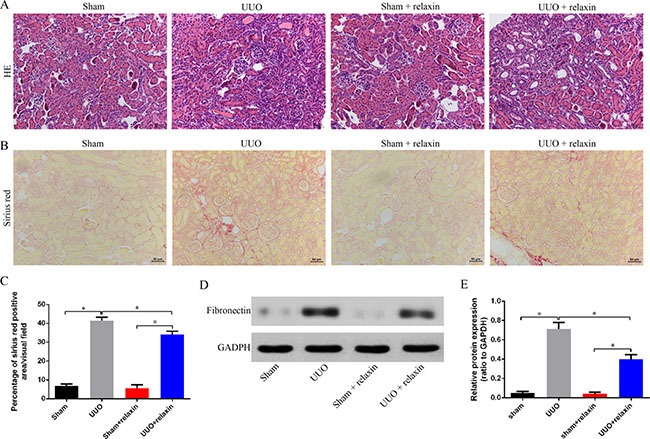
Figure 1. Relaxin alleviates fibrosis following UUO.

(A–B) Representative images (eight visual fields for each tissue analyzed) of H&E (A), Sirus red (B) staining of kindrys frong the indicated experimental groups. Scale bars, 50 μm. (C) Interstitial fibrosis on basis of Sirius red staining. n = 8 per group;*p < 0.05. (D, E) Whole kidney lysates from kidneys of the mice pretreated with deionized water or relaxin following UUO (sham, UUO, sham + relaxin and UUO + relaxin) were analyzed for changes in fibrosis (fibronectin) by western blot analysis. Expression of the indicated proteins in the kidneys was analyzed by densitometry normalized to glyceraldehyde 3-phosphate dehydrogenase (GADPH) and expressed as mean ± sd. n = 8 per group; *p < 0.05.
