
Figure 3. Relaxin shifts macrophage polarization toward the M2 phenotype in vitro.
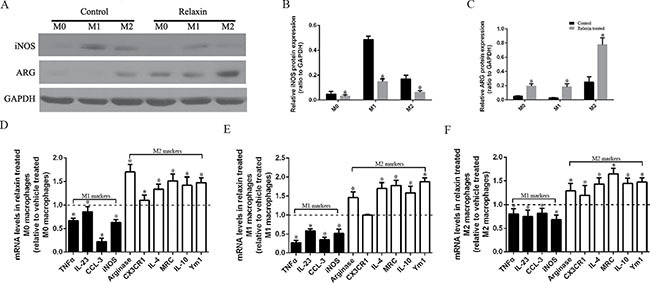
Raw 264.7 cells were treated with deionized water (M0), interferonγ(IFNγ) (M1) or IL-4(M2) and (A–C) analyzed for the expression of M1 marker iNOS and M2 marker arginase (Arg) after treated with vehicle (deionized water) or relaxin by western blot analysis. Protein expression data were normalized to GADPH, analyzed, and represented as mean ± sd; *p < 0.05 vs. vehicle treated groups(control groups). (D–F) M0, M1 and M2 macrophages were analyzed for the expression of M1 (TNF-α, IL-23, CCL3, iNOS) and M2 (arginase, CX3CR1, IL-4, MRC, IL-10, Ym-1) genes after treated with vehicle (deionized water) or relaxin by real-time PCR. Experiments were performed at least three independent times and gene expression data were normalized to GAPDH, analyzed, and represented as mean ± sd; *p < 0.05 vs. vehicle treated groups (control groups).