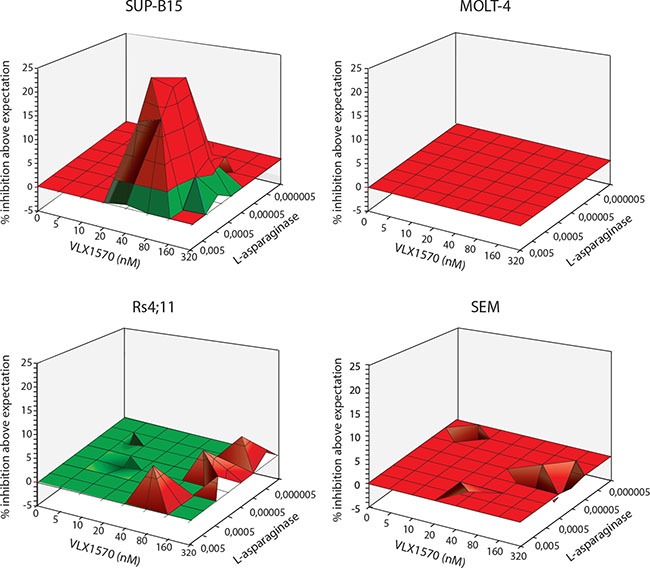
Figure 5. Analysis of combinatory effects of VLX1570 and L-Asp on ALL cell viability.

Cells were exposed to the indicated drug concentrations and viability was determined by MTT assay after 72 hours. MacSynergy software ([41]https://www.uab.edu/medicine/peds/macsynergy) was used to calculate the efficiency of drug combinations to reduce cell viability. Synergy plots generated by the MacSynergy™ II software reflect the difference between experimentally determined results and the theoretical drug interactions, calculated from the dose response curves for each drug individually. The resulting plot appears as a flat surface for an additive effect, peaks indicate synergy and depressions indicate antagonism. We observe additive effect in 3 cell lines (MOLT4, RS4;11 and SEM) and synergy was observed in SUP-B15 cell line. The log volume of the synergy plot of SUP-B15 cells was 23.2, a value described as strong synergy [41]. No antagonistic effect was observed in the tested cell lines.
