
Figure 1. The consumption of tobacco cigarettes for the TAS2R38-CA6 genotypes by colorectal cancer phenotype. Each bar presents mean ± standard deviation.
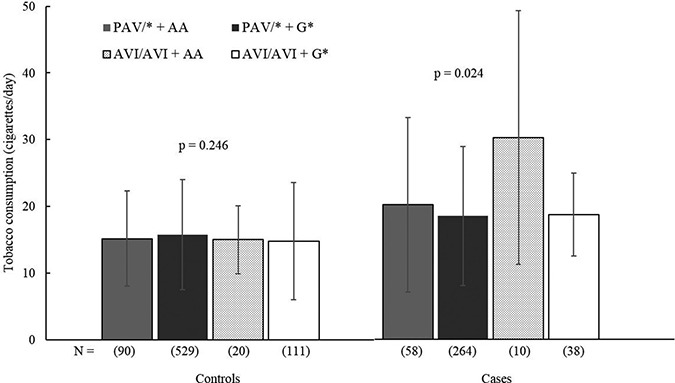
The mean consumption was estimated among current/former smokers. Numbers in brackets represent the numbers of subjects. P-values are from generalized linear models adjusted for sex, age, body mass index, alcohol drinking, regular exercise, family history of colorectal cancer, marital status, education level, household income and dietary zinc intake. No significant difference between pair of genotypes was estimated by Tukey's tests.