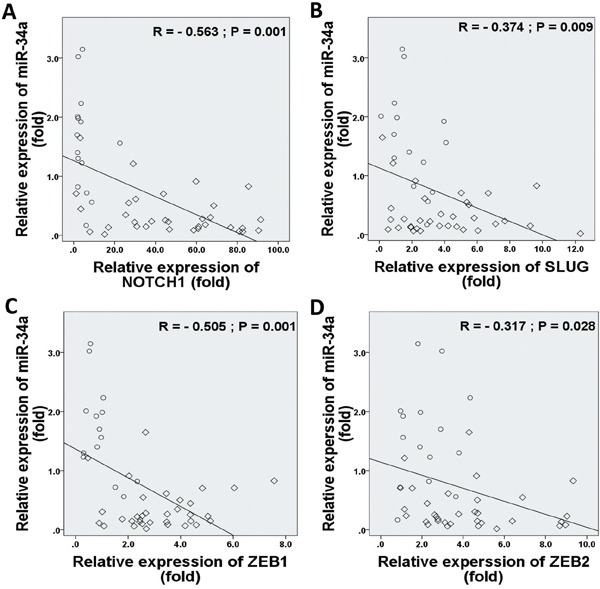
Figure 5. Correlations between relative expression levels of NOTCH1 A., SLUG B., ZEB1 C., and ZEB2 D. with miR-34a expression level.

Data indicate significantly negative associations in EMT-TFs and miR-34a expressions in MBC patients. The diamond indicates human BC specimens (n = 33), and circles represent paired adjacent normal tissue (n = 15). Data were analyzed by Spearman's rank correlation coefficient.
