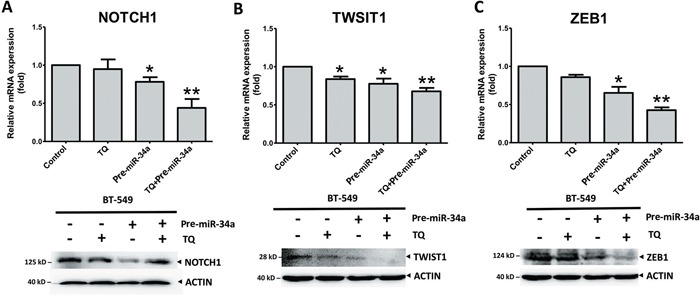
Figure 7. Synergic effects of thymoquinone (TQ) and miR-34a on mRNA (top panel) and protein (bottom panel) level expression of EMT-TFs.

TQ (5 μM) treatment for 6h for RT-PCR or 12h for Western blot pre-miRNAs (20 ng of each) treatment for 36 h inhibited the expression of NOTCH1 A., TWIST1 B., and ZEB1 C. in the BT-549 cell line. Results expressed as mean ± SD, and independently repeated with three times. qRT-PCR results normalized to 18S or U6 and compared with the untreated cells as a control. In western blot β-actin (ACTIN) as an internal control (* P<0.05 and ** P<0.001 versus control group).
