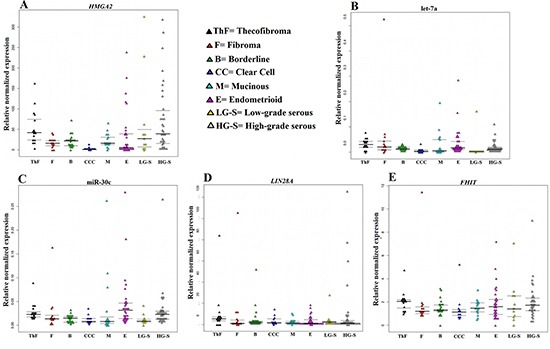
Figure 1. Relative normalized expression of HMGA2, LIN28A, and FHIT as well as the miRNAs miR-30c and let-7a.

The relative expression of HMGA2 (A), LIN28A (D), FHIT (E) and the miRNAs let-7a (B) and miR-30c (C) is correlated with histotype.

The relative expression of HMGA2 (A), LIN28A (D), FHIT (E) and the miRNAs let-7a (B) and miR-30c (C) is correlated with histotype.