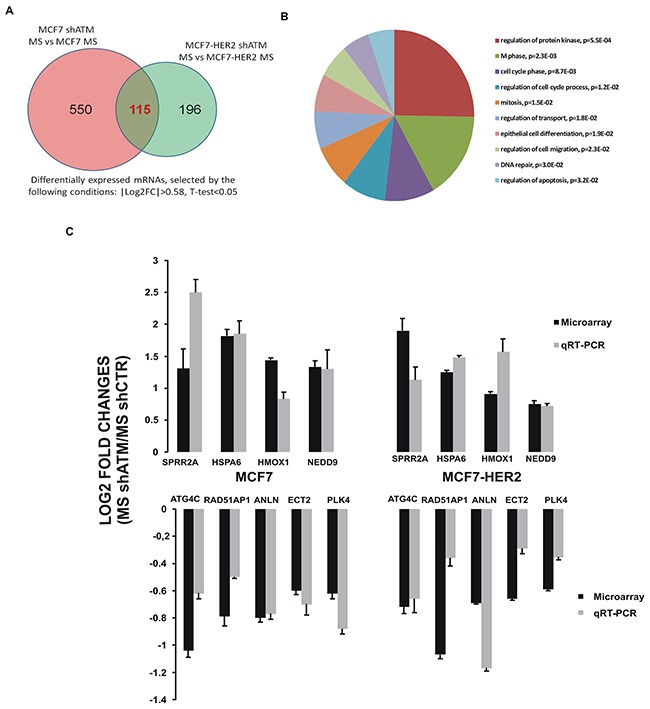
Figure 3. Gene expression profiling of mammospheres with or without interfering ATM expression.

A. Number of differentially expressed mRNAs between mammospheres silenced for ATM and control mammospheres, obtained from three independent experiment performed with both targeting sequences for ATM (shATM#1 and shATM#3) and selected by the following conditions: |Log2FC|>0.58, T-test<0.05. In the Figure are shown the number of differentially expressed genes in mammospheres derived from MCF7 and from MCF7-HER2 cells. The intersection area encloses 115 common genes between mammospheres derived from both cell lines. B. Gene Ontology analysis of intersection set (115 mRNAs), obtained by the DAVID online tool. C. Microarray and qRT-PCR comparison. Log2 Fold Change of 9 genes between mammospheres shATM vs shCTR detected by microarray (black lines) were compared with those measured by qRT-PCR (grey lines). Positive values represent gene expression upregulation and negative values downregulation in mammospheres silenced for ATM gene (shATM) compared to control cells (shCTR). qRT-PCR results were normalized with TBP. Error bars indicate standard deviations of at least three independently performed experiments.
