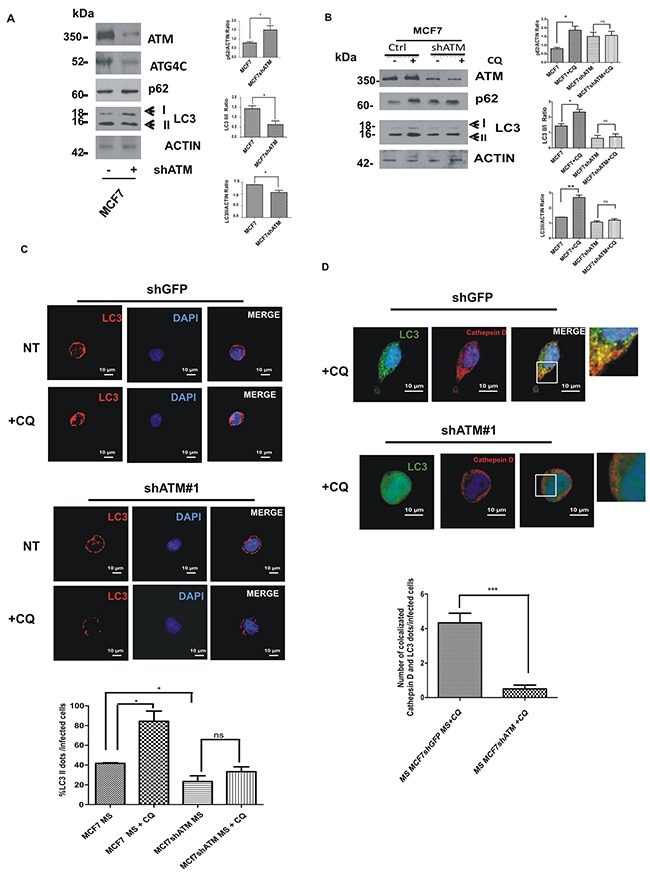
Figure 6. ATM expression regulates ATG4C levels and autophagic flux in mammospheres (MS).

A. Representative Western Blot analysis of ATM, ATG4C, p62 and LC3 protein levels in mammospheres (MS) derived from MCF7 cell lines, with or without shATM. Actin was used as loading control. The graphs represented quantification of LC3 II/I ratio, LC3II/actin and p62/actin ratio was determined using the ImageJ software. Results are indicated as mean±s.d. for three independent experiments performed with both targeting sequences for ATM (shATM#1 and shATM#3) and analysed using Student's t-test (*P<0.05, **P<0.01, ***P<0.001). B. Representative Western Blot analysis of p62 and LC3 proteins in mammospheres (MS) with or without shATM and treated with CQ (20 μM, 30 min). Actin was used as loading control. The graphs represented quantification of LC3 II/I ratio, LC3II/actin and p62/actin ratio was determined using the ImageJ software. Results are indicated as mean±s.d. for three independent experiments performed with both targeting sequences for ATM (shATM#1 and shATM#3) and analysed using Student's t-test (*P<0.05). C. Representative image, using confocal microscopy, ofthe formation of autophagosome assayed by immunofluorescence for endogenous LC3 protein in MCF7 cells seeded from dissociated mammospheres. Mammospheres were treated or not with choloroquine CQ (20 μM, 30 min) for analysing autophagic flux. The graph show the accumulation of LC3 dots per infected cells. Results are expressed as the mean±s.d. for at least three independent experiments performed with both targeting sequences for ATM (shATM#1 and shATM#3) and analysed using Student's t-test (*P<0.05). D. Representative image, using confocal microscopy, of the lysosomal degradation of autophagosomes assayed by immunofluorescence for endogenous LC3 and Cathepsin D proteins in MCF7 cells seeded from dissociated mammospheres. Mammospheres were treated with choloroquine CQ (20 μM, 30 min) in order to visualize the autophagosome degradation (co-localization LC3-II dots with Cathepsin D). The graph indicates a clear reduction of LC3-II dots co-localizing with Cathepsin D in ShATM infected cells. Results are expressed as the mean±S.D of at least three independent experiments performed with both targeting sequences for ATM (shATM#1 and shATM#3) and analysed using Student's t-test ( ***P<0.001).
