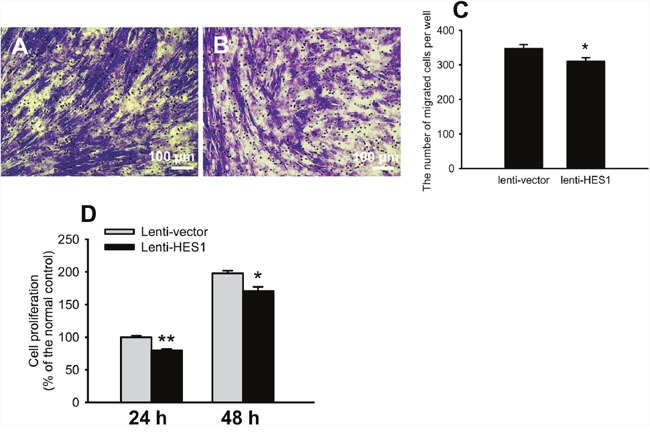
Figure 8. HES1 overexpression impaired the cell migratory and proliferative functions.

Representative pictures of cell migration were shown in (A) and (B). Quantification showed that cell migration was reduced by overexpressing HES1 (C). Cell proliferation was compromised at both 24 and 48 h following HES1 overexpression (D). The data were presented as mean ± SEM (n = 3 ∼ 10 per group for each experiment, each experiment was repeated 3 times, * p < 0.05, ** p < 0.01).
