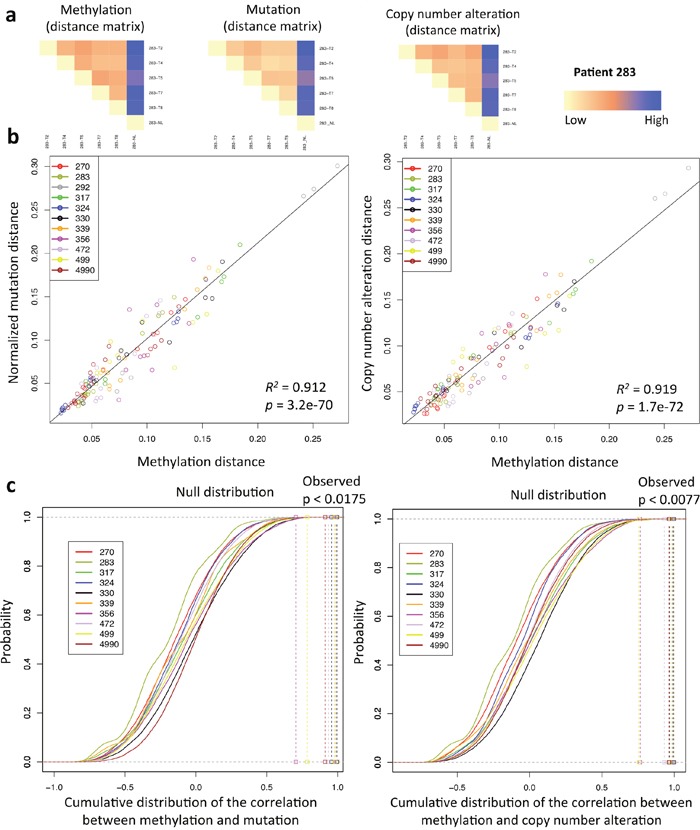
Figure 2. Relationship between methylation and genomic landscape.

(a) An illustration of methylation and genomic distance matrices comparison. Heat maps show the Euclidean distance for all samples of patient 283 based on methylation, mutation, and copy number alteration profiles. (b) Linear regression analysis of all samples between methylation and mutation or copy number alteration Euclidean distance matrices. With respect to the mutation data, each element of the resulting distance matrix was divided by the sum of mutation distance for each patient to obtain the normalized mutation distance. (c) Bootstrapping analysis of all samples. The correlation coefficient between methylation and mutation or copy number alteration Euclidean distance matrices of each patient was compared to the null distribution that was obtained by randomly shuffling the labels of methylation and genomic Euclidean distance matrices for 100,000 times.
