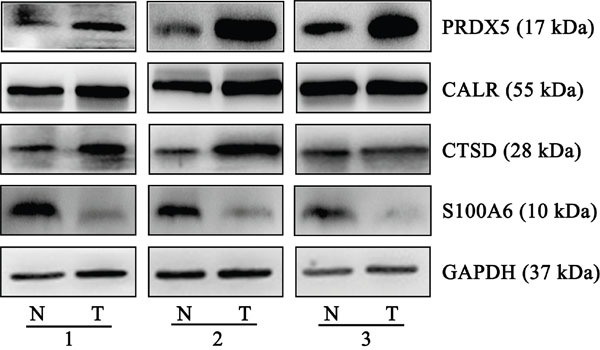
Figure 3. Representative western blots of PRDX5, CALR, CTSD and S100A6 in gastric cancer and normal tissues.

Compared with normal tissues, gastric cancer tissues from three individual pairs presented up-regulation of PRDX5, CALR, and CTSD, and a marked down-regulation of S100A6. The experiments were repeated at least three times, N represents normal tissue and T represents tumor tissue.
