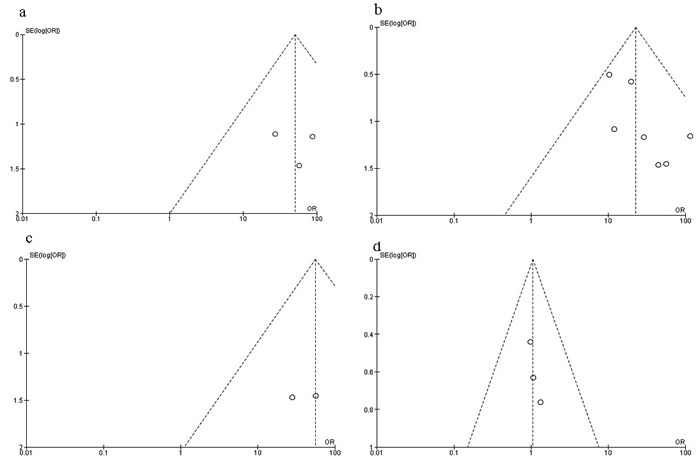
Figure 9. Funnel plot for publication bias.

a. RUNX3 methylation in DCIS and normal breast tissue; b. RUNX3 methylation in IDC and normal breast tissue; c. RUNX3 methylation in IDC and benign tumor; d. RUNX3 methylation in IDC and DCIS. Y-axis represents the standard error, X-axis represents order ratio, Area of the circle represents the weight of individual study.
