
Figure 7. FNCS1 and α4 integrin (CD49d) expression in CIDP patient nerve biopsies.
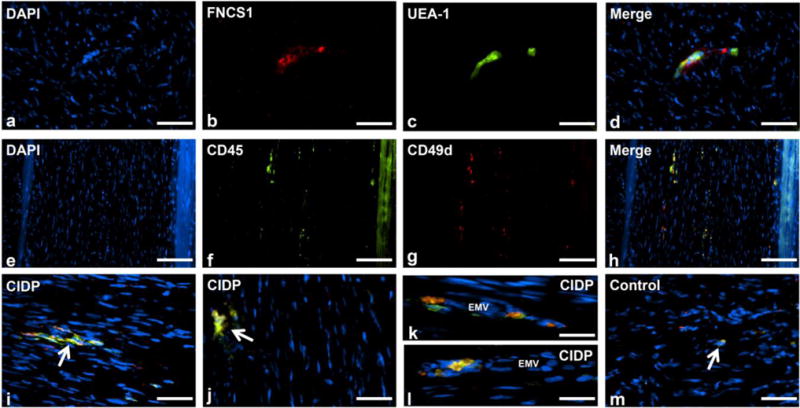
Digital indirect fluorescent photomicrographs of an axial section from the sural nerve biopsy of an untreated CIDP patient demonstrates a cluster of round mononuclear cells (a: DAPI, blue) associated with a FNCS1 expressing (b: red) endoneurial microvessel (c: UEA-1, green), verified by co-localization in the merged image (d: yellow). Longitudinal sural nerve biopsy sections show multiple small foci of endoneurial CD49d+ CD45+ leukocytes at lower magnification (e–h). Higher magnification photomicrographs from different untreated CIDP patients show clusters of endoneurial CD49d+ CD45+ leukocytes (i and j: white arrows). Extravasating and perivascular CD49d+ CD45+ leukocytes are also seen (k and l). CD49d+ CD45+ leukocytes were rarely seen within the endoneurium of normal control sural nerve biopsies (m: white arrow). EMV= endoneurial microvessel. Scale bars = 50 μm (a–d), 100 μm (e–h), 40 μm (i, j and m) and 20 μm (k and l)