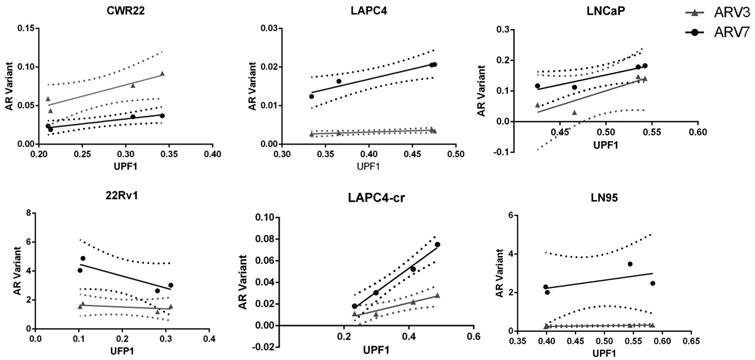
Figure 5. Linear Regression Analysis of ARV3 and ARV7 v. UPF1.

Correlation between expression levels of ARV3 or ARV7 vs. UPF1 was determined by linear regression analysis. Solid lines indicate linear regression, and dashed lines indicate confidence interval bands. Significant deviations from slopes of zero (indicated by p-values < 0.0.5) were found in CWR22 (ARV7 v. UPF1, p = 0.04), LAPC4 (ARV3 v. UPF1, p = 0.03), and LAPC4-cr (ARV3 v. UPF1, p =0.03 and ARV7 v. UPF1, p = 0.006).
