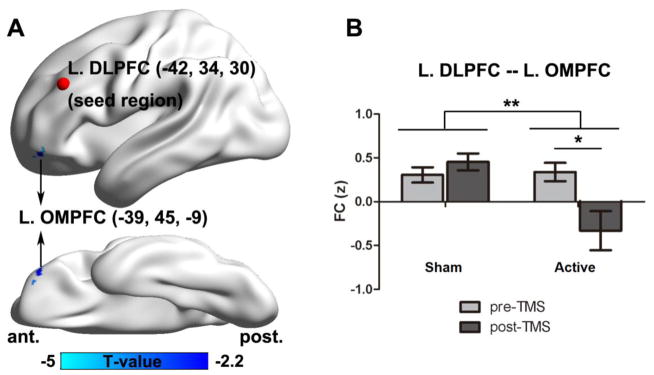
Figure 3.
The comparison of the connectivity of the DLPFC and the orbital medial prefrontal cortex (OMPFC) between active and sham-TMS (A). The connectivity of DLPFC (−42, 34, 30) and OMPFC (−39, 45, −9) (B). The bar graph shows the mean functional connectivity (FC) in sham and active TMS treatment. * p<.05, **p<.01

