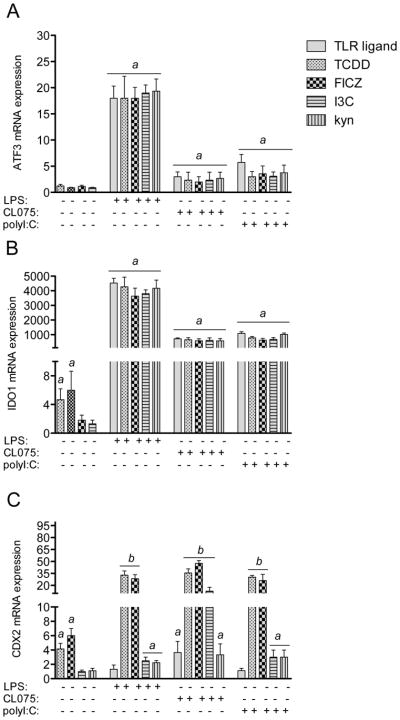
Figure 3.
Expression of A) ATF3, B) IDO1, and C) CDX2 in AhR- and TLR-activated MoDCs. Cells were treated with 10 nM TCDD, 100 nM FICZ, 50 μM I3C, or 50 μM kyn in absence or presence of LPS (50 ng/ml), CL075 (5 μg/ml), or poly(I:C) (5 μg/ml) for 24h. Results from real-time PCR are presented as mean ± SEM and the y-axis represents mRNA expression level as fold increase above control. a significantly higher than non-activated DC control, p < 0.05; b significantly higher than TLR- and AhR-activated MoDCs, p < 0.05

