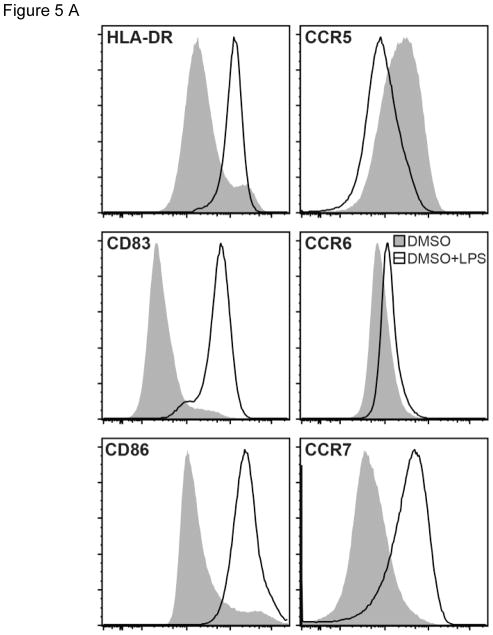
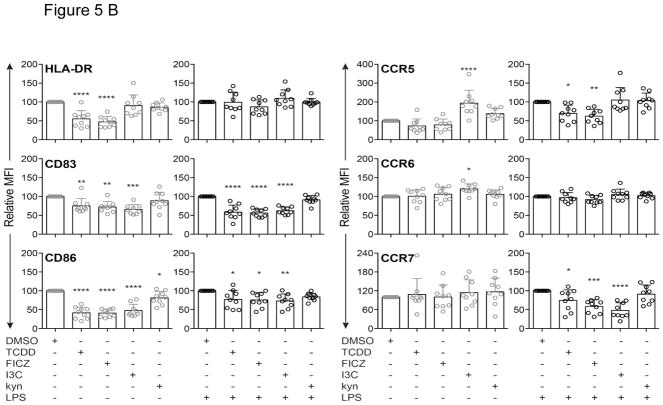
Figure 5.
Modulation of MoDC surface markers by AhR ligands in the presence or absence of LPS. A) Representative overlaid histograms of surface marker expression by MoDCs treated with LPS (50 ng/ml) or DMSO control. B) Comparison of surface marker expression by MoDCs treated with TCDD (10 nM), FICZ (100 nM), I3C (50 μM), or kyn (50 μM) in absence or presence of LPS for 24 h. The surface markers HLA-DR, CD83, CD86, CCR5, CCR6, and CCR7 were analyzed by flow cytometry and data are presented as relative mean fluorescence intensity (MFI) with DMSO control set as 100. Data are presented as mean ± SD with each data point representing an individual donor (n = 9). The significance of difference between DMSO control and each treatment was determined by one-way ANOVA, with Dunnett’s multiple comparison test used to perform pairwise analysis. Symbol: * p < 0.05; ** p<0.01;*** p<0.001; **** p<0.0001.


