Figure 4.

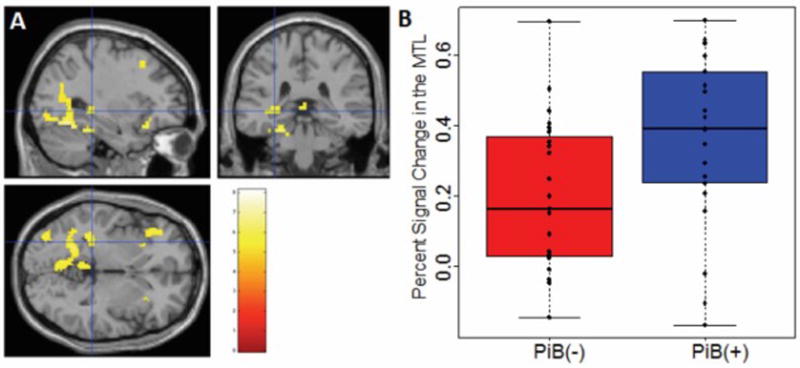
a. Main effect of Novel > Control contrast in the whole group. (T(43)>4.97, FWE corrected p<0.05., cluster=48 voxels, MNI coordinates: −30, −34, −2); b. Box and whisker plot of MTL activation in PiB(−) (red) versus PiB(+) (blue).

a. Main effect of Novel > Control contrast in the whole group. (T(43)>4.97, FWE corrected p<0.05., cluster=48 voxels, MNI coordinates: −30, −34, −2); b. Box and whisker plot of MTL activation in PiB(−) (red) versus PiB(+) (blue).